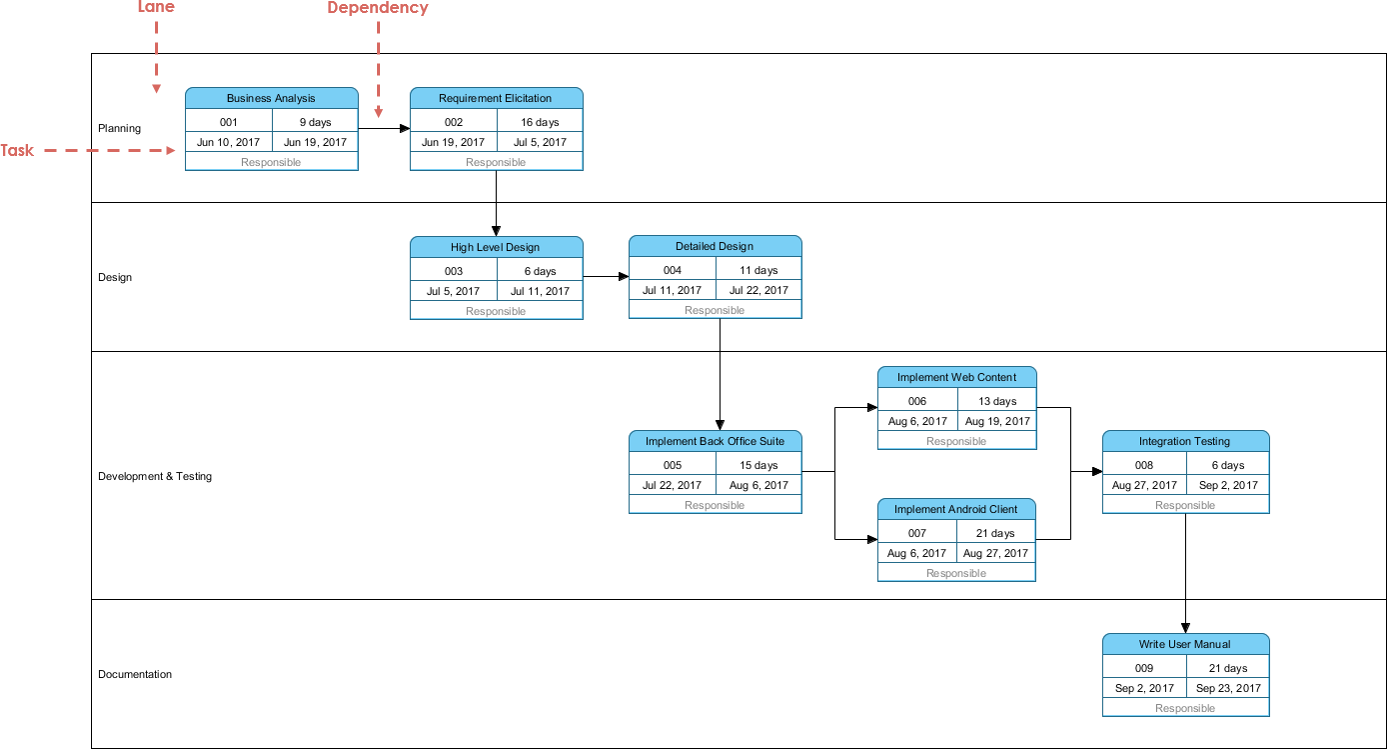
Here is a PERT chart example. PERT, short for Project Evaluation and Review Technique, is a popular project management tool used to represent, schedule and coordinate tasks involved in a project. In a PERT chart, tasks are represented as a network of nodes. The direction of connectors among tasks indicate the sequence of tasks.
This PERT Chart example shows an example of PERT Chart that shows the major, high level development activities in a software project. It consists of three major components:
Lane: A lane organizes and categorizes tasks into a group associated with a concept such as a phase or a person.
Task: A piece of work involved in project. Each task consists of a task name, an ID, the start and end date, and the person who are responsible for it.
Dependency (connector): Shows the sequence of tasks. A task cannot begin until one or more tasks have occurred, begun or completed.
Import into your Project
Open diagram in Visual Paradigm [?]Copy the URL below, paste it in the Open Project windows of Visual Paradigm and press Enter to open it |
Posted by: Howard Pruitt