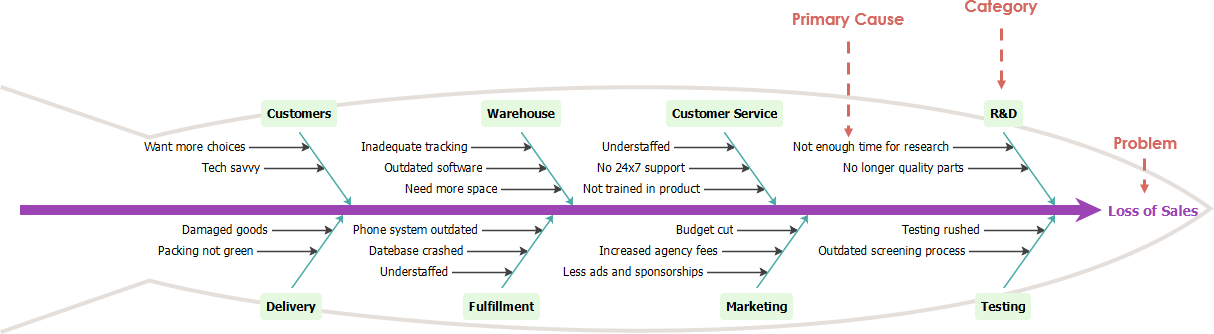
Here is a cause and effect diagram example.
Created by Kaoru Ishikawa, a Japanese QA professional, who use this method to help his employees to avoid solutions that merely address the symptoms of a much larger problem. Ishikawa diagram, also called a cause and effect diagram or fishbone diagram, is a presentation and brainstorming tool for categorizing the potential causes of a problem in order to identify its root causes. Here we give an example on how the Fishbone Diagram is used in a real life problem.
Import into your Project
Open diagram in Visual Paradigm [?]Copy the URL below, paste it in the Open Project windows of Visual Paradigm and press Enter to open it |
Posted by: Carol Sandusky
Next Read: Generic Work Breakdown Structure »