Import into your Project
Open diagram in Visual Paradigm [?]Copy the URL below, paste it in the Open Project windows of Visual Paradigm and press Enter to open it |
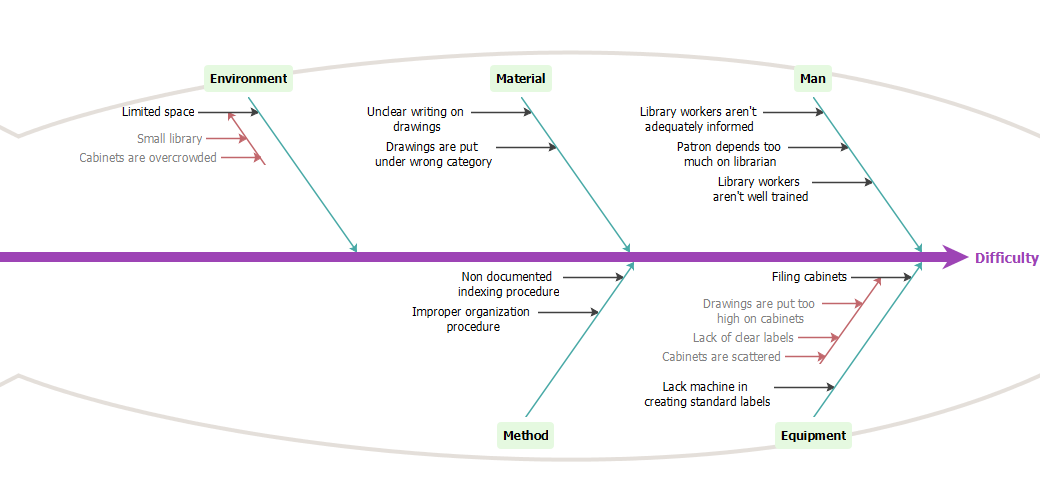
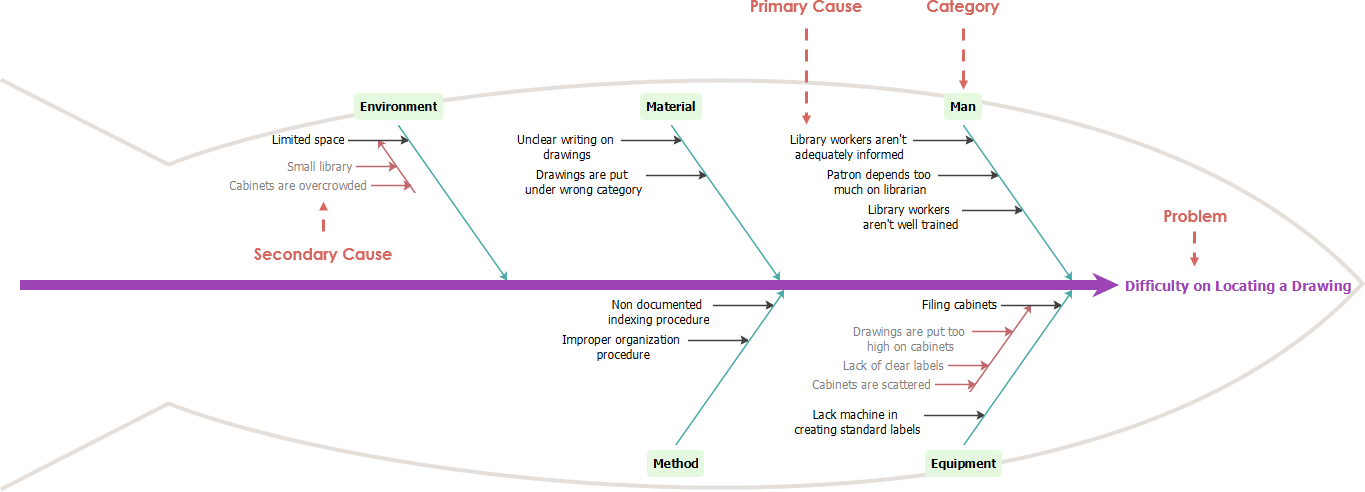
Here is a fishbone diagram example. The fishbone diagram is an analysis tool that provides a systematic way of looking at effects and the causes that create or contribute to those effects and it also known as the Cause and Effect Diagram or Ishikawa Diagram, is a graphical tool used to identify and explore on a single chart, in increasing detail, the possible causes which lead to a given effect. They are a structured framework that takes advantage of the collective knowledge of a team to identify the main causes of the effect under study. The ultimate aim is to work down, or drill-down, through the causes to identify basic root-causes of a problem. Here is an example of use of an Ishikawa diagram to solve a difficulty in locating a drawing.
Posted by: Carol Sandusky


