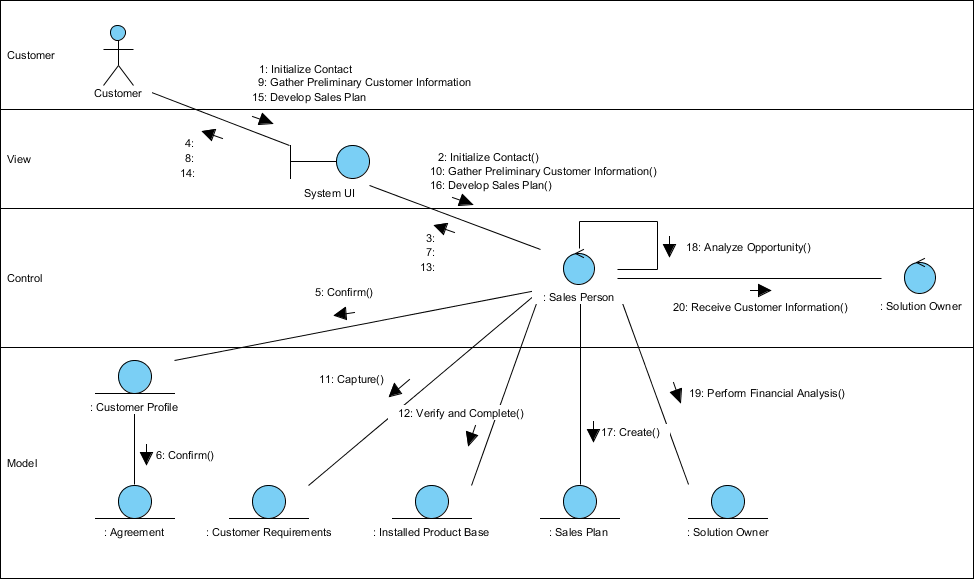
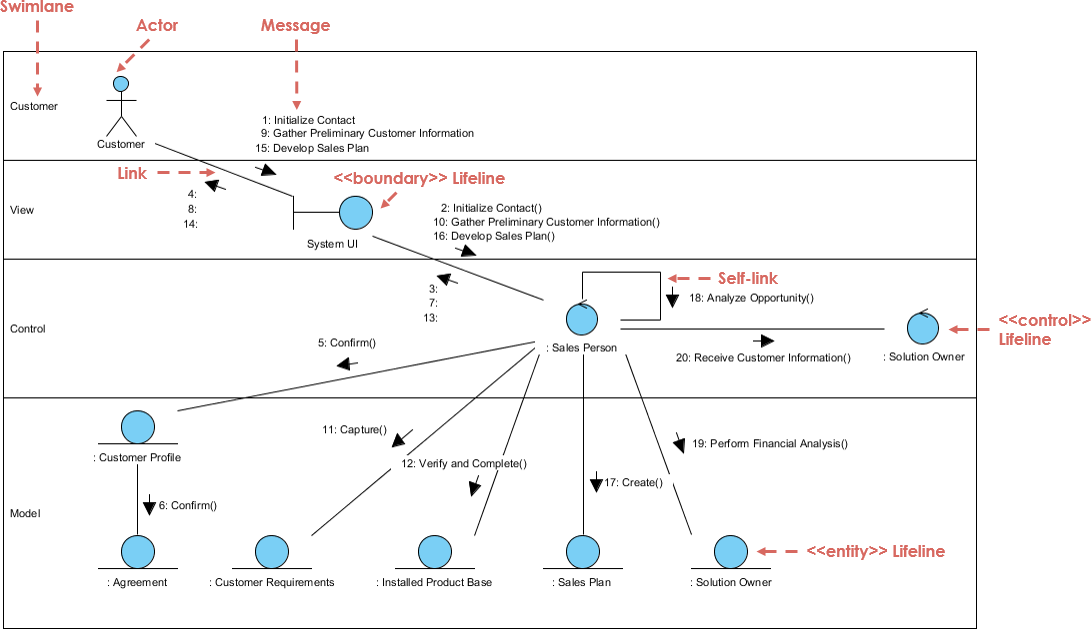
This is a Communication Diagram for financial analysis.
A business collaboration diagram documents how business workers and business objects actually interact to perform a business function. Collaboration diagrams show the messages exchanged between business workers and business entities during the course of realizing a business use case (implementing a business process). Collaboration diagrams can clearly indicate areas of improvements by visually showing business workers being responsible for a large number of tasks.
This example shows a view of participating business workers (Sales Person, Solution Owner) and business entities (Customer Profile, Sales Plan, etc) in a Proposal process in an MVC 3 layered structure.
Import into your Project
Open diagram in Visual Paradigm [?]Copy the URL below, paste it in the Open Project windows of Visual Paradigm and press Enter to open it |
Posted by: Steven Guarino

