A stereotype defines how a model element may be extended, and enables the use of platform or domain specific terminology or notation in place of, or in addition to, the ones used for the extended metaclass. In Visual Paradigm, you can apply one or more stereotypes to model elements, and decide whether or not to visualize the stereotype or tagged values in views. To apply stereotype to model element:
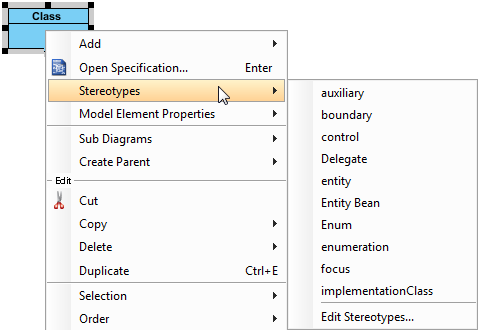
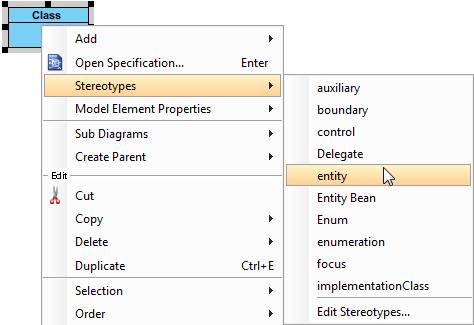
- Right click on the model element, or the view of the model element that you want to apply stereotype to. Select Stereotypes from pop-up menu.

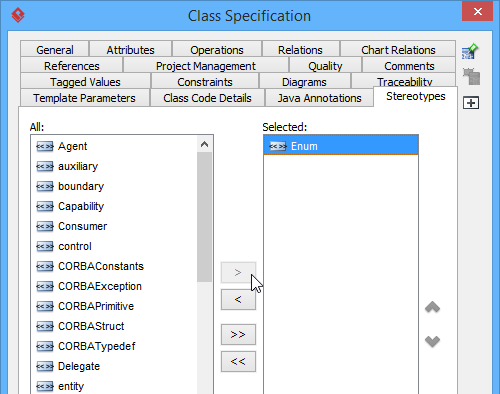
Depending on the type of model element you are selecting, there may be a list of suggested stereotypes listing in the menu popped up. It consists of both the recently used stereotypes and stereotypes that place at the top of stereotype list. If you see the stereotype you want to apply, select it. Otherwise, select Stereotypes… at the bottom of the menu to look for others. - In the Stereotypes tab of specification window, select the stereotype you want to apply, then click > to assign it to the Selected list.

- Click OK to confirm. The stereotype will then be shown within a pair of guillemets above the name of the model element. If multiple stereotypes are applied, the names of the applied stereotypes are shown as a comma-separated list with a pair of
guillemets.

Robustness analysis icon
Robustness analysis helps to find out the relationships between actor, boundary, control and entity objects.
![]()
To draw a robustness analysis diagram with robust analysis symbols:
- Create a class in diagram.
- Depending on the type of robustness analysis symbol you want to create, apply either boundary, control and entity stereotype to the class.

Presenting a shape as stereotype icon
You can specify icon for a stereotype (Read the next chapter for details). When a stereotype is applied to a model element, you can let the stereotype icon show above the name of model element, which is the default presentation, or to make the model element show as the icon. To present a shape as stereotype icon, right click on the shape and select Presentation Options > Stereotype Icon from the popup menu.
![]()
Showing or hiding stereotype
By default, applied stereotypes are shown within a shape. Yet, it is up to you whether to show or hide them. Furthermore, you can choose not to display the stereotypes, but to display only their tagged values.
To update the visibility of stereotypes, right click on the background of diagram where the shapes exist. Select/De-select Presentation Options > Show Stereotypes from the popup menu.
