As your project evolves and grows bigger and bigger, more and more dependencies will be established among model elements. To ensure a change you attempt to make will not jeopardize the other parts of the model, use the Analysis Diagram to analyse the impact first. This video shows you how the Analysis Diagram works.
Let's begin with this Class Diagram. To edit this class diagram is simple. You can double click on a class’ name to rename it, select a class and hit the Delete key to remove it, and of course you can do the same on attributes.
Editing is straightforward when you're working in a diagram like this. You’re clear about the consequences of changes because everything is in this diagram. But if the model elements exist in multiple diagrams or in relationship with other elements, the change you made may affect the other parts of your model. The consequence of changes may not be so clear. Here is an example.
To delete the class “Author” in this diagram may cause the existence of Class “Author Controller” in another diagram meaningless or wrong.
This is another example. To rename the entity from “Invoice” to “Bill” may cause ambiguity when another part of the model do treat the entity as an invoice instead of a bill. For instance the “Issue Invoice” task with a reference to the “Invoice” entity.
So before you make any significant changes, or you feel that your change may potentially affect the other parts of the model, it is recommended that you first identify the impact and revise the action of change, which can be: Keep executing the change, no change, or keep changing but amend impacted elements accordingly.
While the change is subject to the decision, the identification of impact is what you can achieve by using an analysis diagram.
Let’s take a look at how the analysis diagram works.
To create an analysis diagram is very simple. Unlike other diagrams, analysis diagram is not created through the New Diagram window. Instead, right click on the shape or the model elements that you want to make a change, and then select Related Elements, and then Analysis from the pop-up menu.
In the pop-up window, enter the name of the diagram then select the kinds of relationships that you want to check.
For example if you want to know the elements that are connected with the inspecting elements, select Relationship.
If you want to know the elements that are referencing, or be referenced by the inspector elements, select Reference.
Click OK.
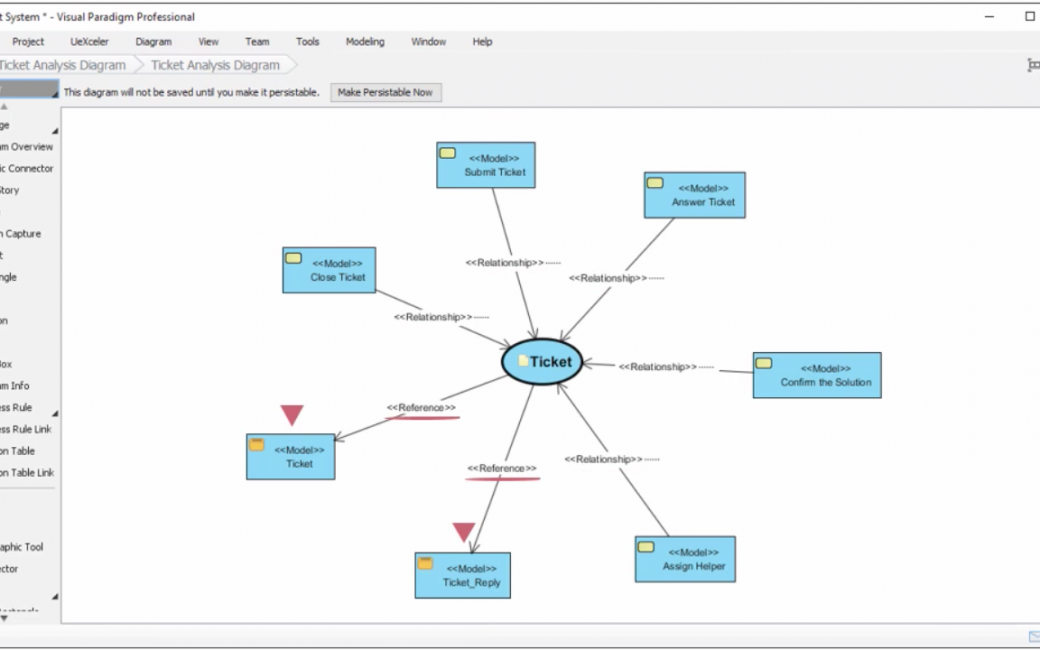
An analysis diagram is formed. Based on this example you can see the tasks that are related with the data object “Ticket”, and the entities that are referenced by the data object.
So, if we are going to make changes on the data object, we can review the impact and make a decision accordingly.
Finally we want to draw your attention to this button.
Unlike other diagrams, analysis diagram is transient. This means that when you save your project, those analysis diagrams will not be saved. If you want them be saved, click the button “Make Persistable Now”, which is the button being pointed in this slide. Once you've done this the diagram will be saved into the project the next time you perform project saving.
This is the end of this video. Thank you for watching.
