Cause and Effect Diagrams Examples |
|
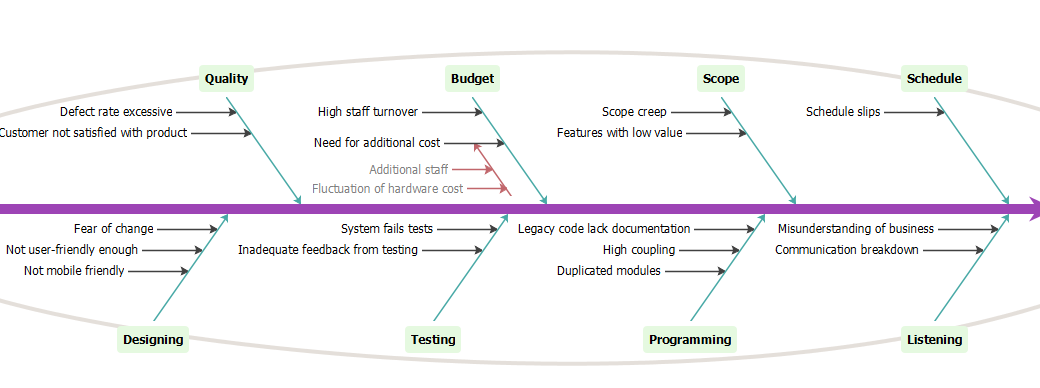
Cause and Effect Diagrams also called Fishbone Diagrams. Examples show you how to explore and identify the potential factors that may be causing or contributing to a particular problem (or effect).
Cause and Effect Diagrams Examples |
|
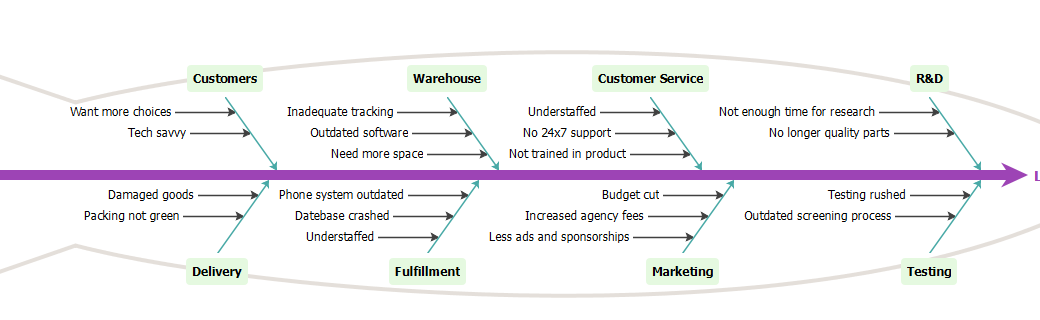
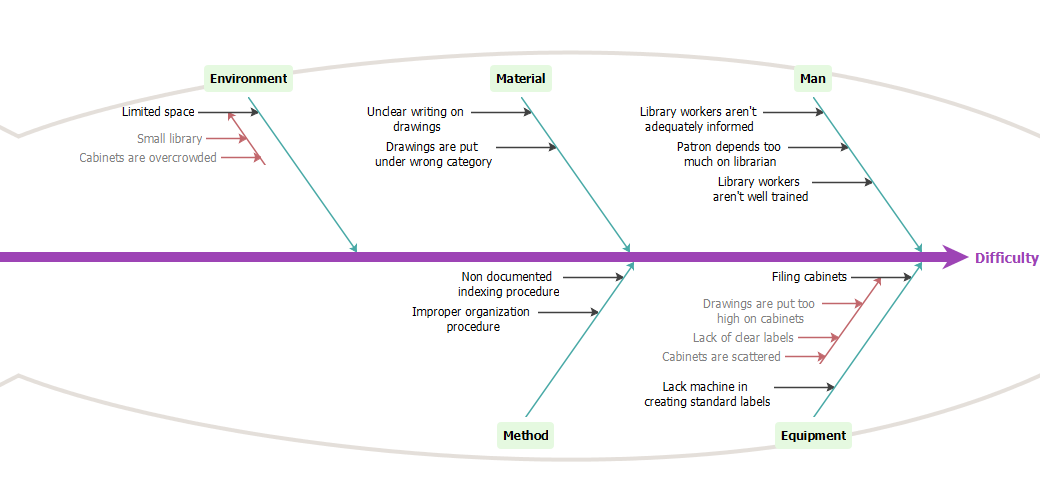
Cause and Effect Diagrams also called Fishbone Diagrams. Examples show you how to explore and identify the potential factors that may be causing or contributing to a particular problem (or effect).