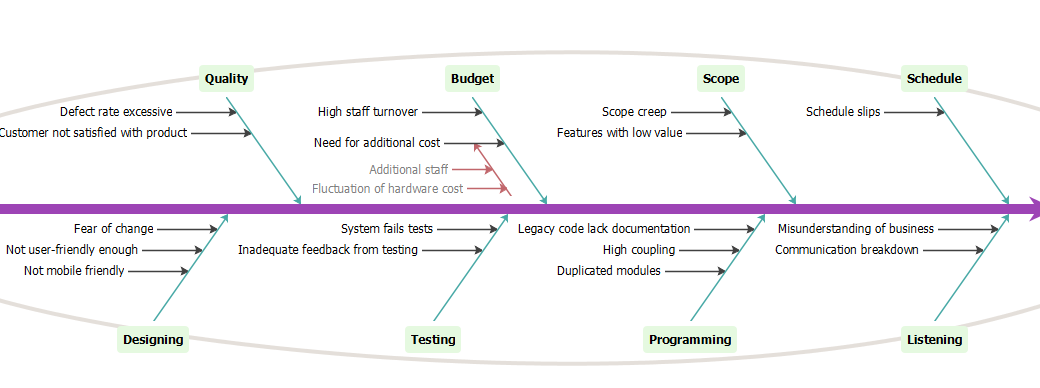
This is a Fishbone Diagram example.
Software could be associated with serious problems, the adoption of agile methods are not immune to such troubles. In order to identify what can go wrong in a project, a project team brainstorm with a cause-and-effect analysis also Ishikawa or fishbone diagram. The value of the analysis is to systematically list all the possible problems that any occur, such as schedule slips might be obvious, but others such as scope creep (the desire to add features after the analyst hears new stories) or developing features with little value are not as obvious.
Import into your Project
Open diagram in Visual Paradigm [?]Copy the URL below, paste it in the Open Project windows of Visual Paradigm and press Enter to open it |
Posted by: Manuel Kearney

