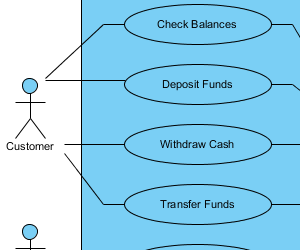
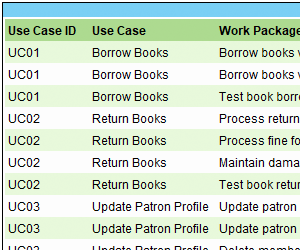
Use Case Diagram
Learn how to capture functional requirements with UML Use Case Diagram. Use Cases in a Use Case Diagram represents the business goals that yields measurable results of business values. The roles that will interact with the Use Cases are modeled as Actors.
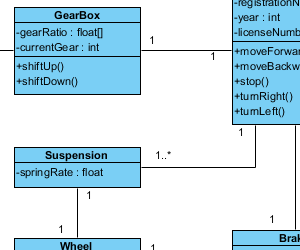
Class Diagram
Class Diagram examples that show you how to model the structure of system with a UML Class Diagram. A UML Class Diagram is a blueprint of the classes (code level) required to build a software system. Programmers implement a software system with the help of both the Class Diagram and the class specification.
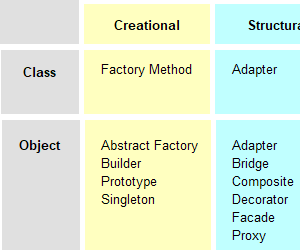
GoF Design Pattern

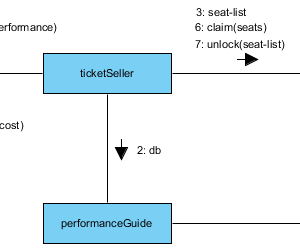
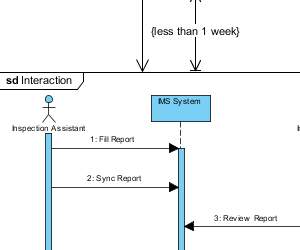
Sequence Diagram
Learn how to model system interactions from the Sequence Diagram examples. Sequence Diagrams visualize the interactions between users, systems and sub-systems over time through message passing between objects or roles.
Communication Diagram
Collaboration between objects in runtime can be modeled in the UML tool, with a UML Communication Diagram. The Communication Diagram examples show you how to model the lifelines (objects) and their inter-relationships in presenting the need of communication during the execution of an interaction.
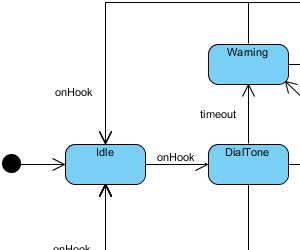
State Machine Diagram
State machine diagram is a critical design model for event-driven systems. Well-designed state machine shows accurately the essential states of objects as well as the triggers of state change. These State Machine Diagram examples show you how to draw such a diagram.
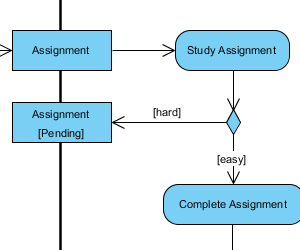
Activity Diagram
Activity Diagram examples that show you the use of UML Activity Diagram, the flowchart-based diagram to model the flow of control.
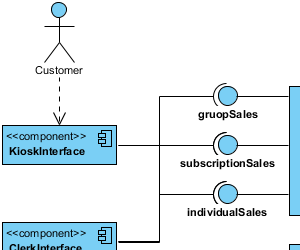
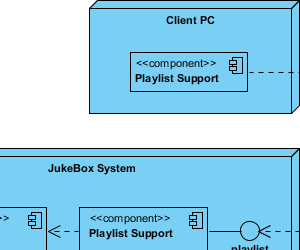
Component Diagram
Components Diagrams are used to model the structure of systems by showing how little parts of the system gear up in forming a bigger part, or forming the entire software systems. A set of Component Diagram examples is provided for you to learn this diagram.
Deployment Diagram
Models the physical deployment of software components with UML deployment diagram. In deployment diagram, hardware components (e.g. web server, mail server, application server) are presented as nodes, with the software components that run inside the hardware components presented as artifacts.
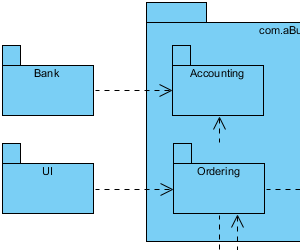
Package Diagram
Arrange and organize model for large-scale project with package diagrams. Package diagram is also good in visualizing structure and dependency between sub-systems or modules. Check out the Package Diagram examples here.
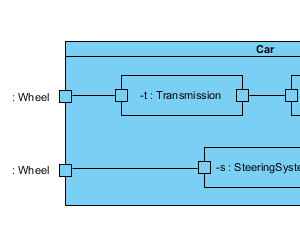
Composite Structure Diagram
Learn structure modeling from Composite Structure Diagram examples. Use Composite Structure Diagram to visualize the internal structure of a class or collaboration. Model a system from a micro point-of-view using UML Composite Structure Diagram.
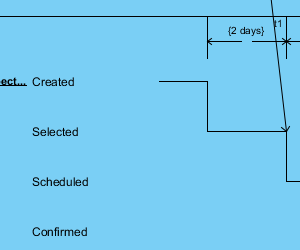
Timing Diagram
Timing Diagrams model the behavior of objects throughout a given period of time. It is a commonly used UML tool for designing real-time and distributed systems. Here you can find a set of Timing Diagram examples for you to learn this UML diagram with ease.
Interaction Overview Diagram
BPMN Diagram
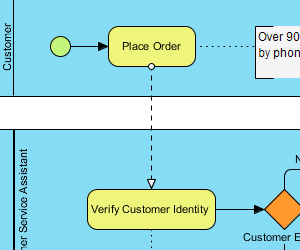
Business Process Model and Notation (BPMN), provides a graphical representation of business workflows that anyone, from business analyst to stakeholder, can easily understand; aiding in business process analysis and business process improvements.
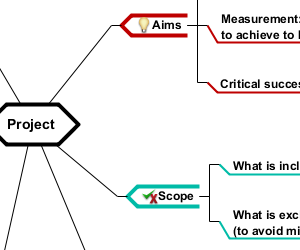
Mind Map Diagram
Leaning how to use mind map to represent ideas and concepts in visual graphical way helping you to structure information, leading you to better analyse, comprehend, synthesize, recall and generate new ideas.

Decision Table
Represent complex decision situations and business rules in the most simplest, organized manner.
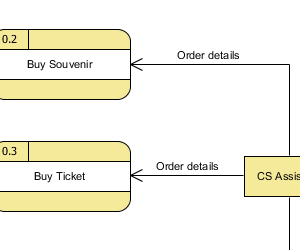
Data Flow Diagram
Examples show you how to use Data flow diagram to visualize the data processing in business analysis field. A data flow diagram is strong in illustrating the relationship of processes, data stores and external entities in business information system.
ArchiMate Diagram
The ArchiMate tool supports all the graphical notations you need to model businesses, information systems and physical technology architectures, and their inter-relationships. ArchiMate 3.0 also supports modeling organization's strategies, the drivers of architecture development and plans for the implementation and migration of architecture.
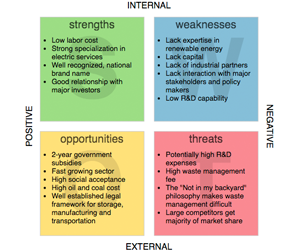
Strategic Analysis
Perform strategic planning and analysis with the new online strategic analysis diagrams. Our new Visual InfoArt allows you to quickly create any kind of strategic analysis model by just typing in the information as bullet points. As you type, the diagram will be formed from the text and continuously updated with the components automatically positioned and arranged.
On-Demand Model ETL
The ETL engine reads and analyzes a specified type of modeling artifacts and extract the desirable information into a models-to-properties table; giving a summarized view of the model elements which could otherwise be scattered all over the diagram and property windows.
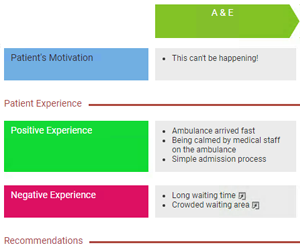
Customer Experience Design
Customer Journey Mapping (CJM) is the visualization of the thoughts and feelings customers have over time. A journey map makes visible the interactions between customers and the business, known as touchpoints. It identifies the blockages that might prevent customers from proceeding smoothly, and develop a holistic view of customer experiences.
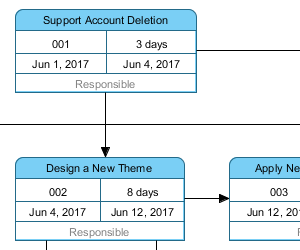
PERT Chart
PERT, short for Project Evaluation and Review Technique, is a popular project management tool used to represent, schedule and coordinate tasks involved in a project. In a PERT chart, tasks are represented as a network of nodes. The direction of connectors among tasks indicate the sequence of tasks.
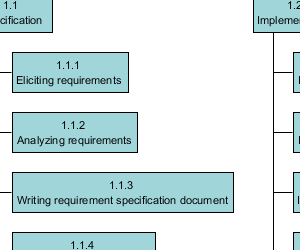
Breakdown Structure Diagram
Examples for breakdown structure as a project management tool includes Work Breakdown Structure (WBS), Resource Breakdown Structure, Risk Breakdown Structure and Organization Breakdown Structure (OBS).
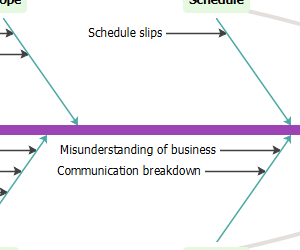
Cause and Effect Diagram
Cause and Effect Diagrams also called Fishbone Diagrams. Examples show you how to explore and identify the potential factors that may be causing or contributing to a particular problem (or effect).
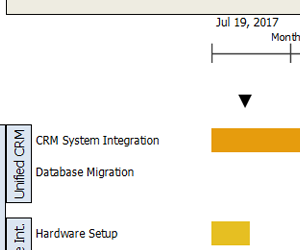
Migration Roadmap
Migration Roadmap represents the time frame of individual sub-projects and the critical transitions, using a migration roadmap. Advanced features like: Project investment point, review point and inter-dependency link among projects are also available.

Implementation Plan Diagram
A project management tool shows how a software project plan at a high level for ensuring the work developed by the development team on time and within budget.
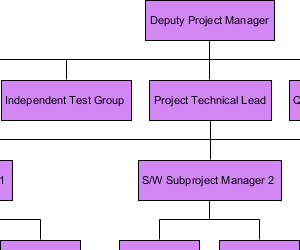
Organization Chart
An organization chart is a diagram that visualizes the formal structure of an organization as well as the relationships and relative ranks of its positions. It is typically drawn and read from top to the bottom.
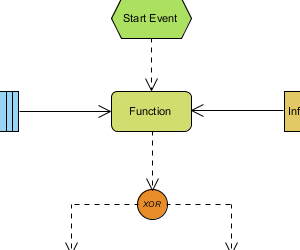
EPC Diagram
EPC diagram, abbreviation for event-driven process chain diagram, is a flowchart based diagram that can be used for resource planning and identifying possible improvements of a business process.
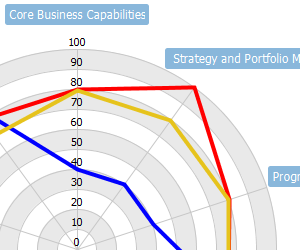
Maturity Analysis (Radar Chart)
Maturity analysis is the process to determine the level of maturity of a given set of factors. Such as, what is the capability level of your development team? With a maturity model, you can easily find answers to all these questions.
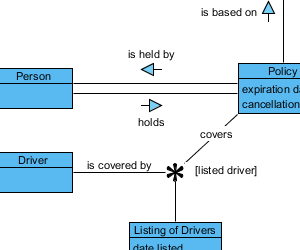
Fact Model
The fact model focuses on the core business concepts (called terms), and the logical connections between them (called facts). The facts are typically verbs which describe how one term relates to another (i.e. Person owns a Car)
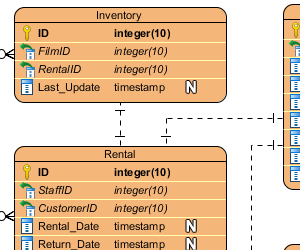
Entity Relationship Diagram
Entity Relationship Diagram (ERD), a database design tool that provides graphical representation of database tables, their columns and inter-relationships. ERD is the most popular database design tool.