Open post

State Diagram – A Toaster (Initial and Extended State Diagram)

Here is a state machine diagram example.

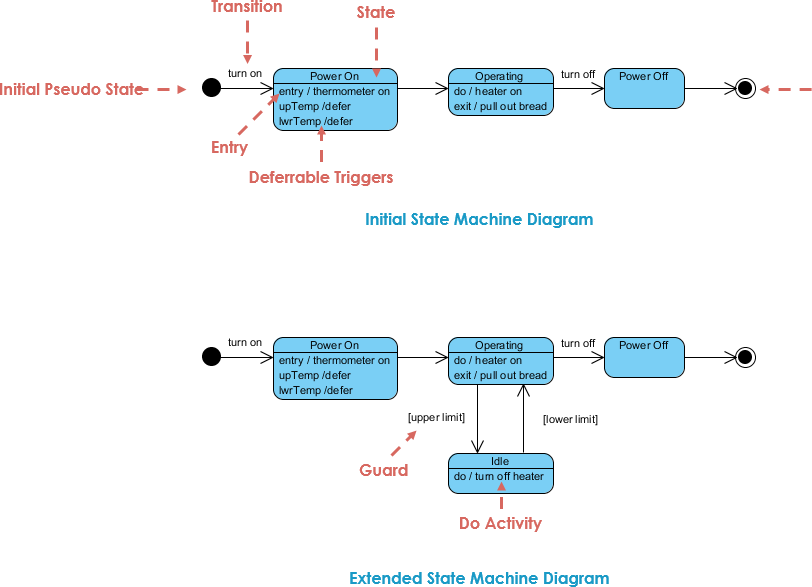
Suppose you're designing a toaster. You would build a plenty of UML diagrams, but here only state diagrams will be of our interest. What are the steps of making a toast? First of all we must turn on the toaster, put in the bread and wait for several minutes to bake it. The initial state diagram is shown here.

But this is not the final state diagram. To prevent burning out the bread, heater of the toaster must produce heat in temperature interval (upper and lower temperature limits). For this purpose thermometer measures the temperature of heater, and when the upper limit of temperature is reached then heater must go into idle state. This state resists until heater's temperature decreases to lower limit, and then working state is again aimed.

Import into your Project
Open post

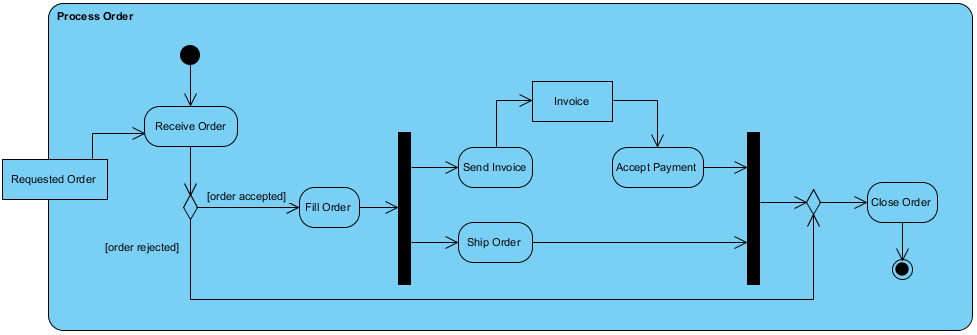
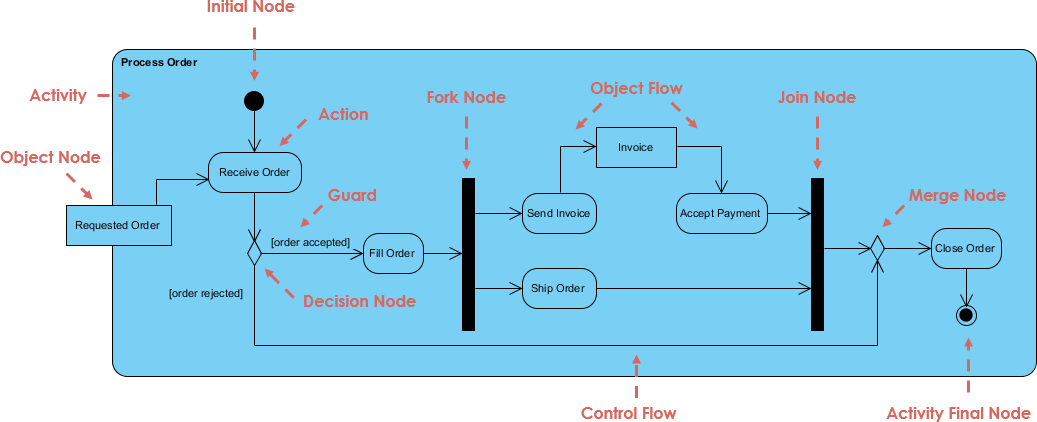
Order Processing

This activity diagram example describes a business flow activity of order processing. In this figure, the requested order is input parameter of the activity. After order is accepted and all required information is filled in, payment is accepted and order is shipped.

Import into your Project
Open post

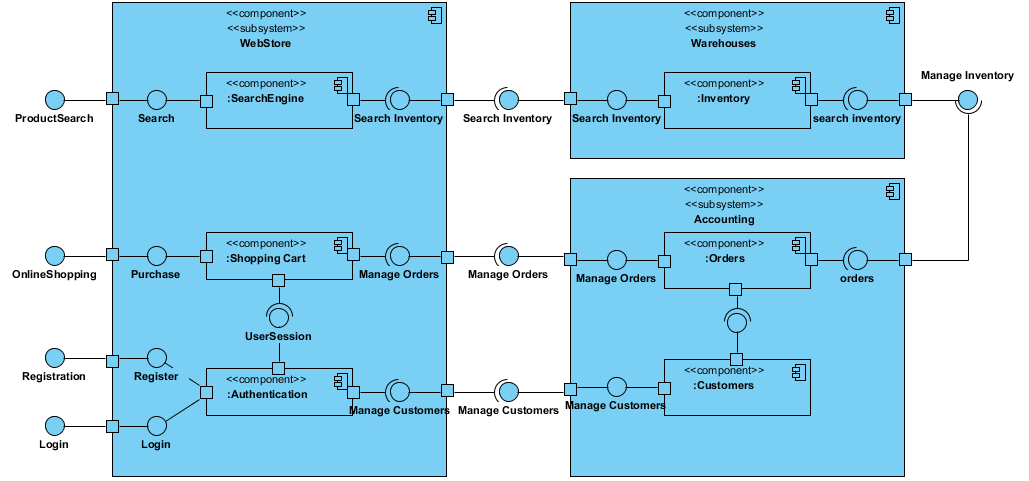
Web Store

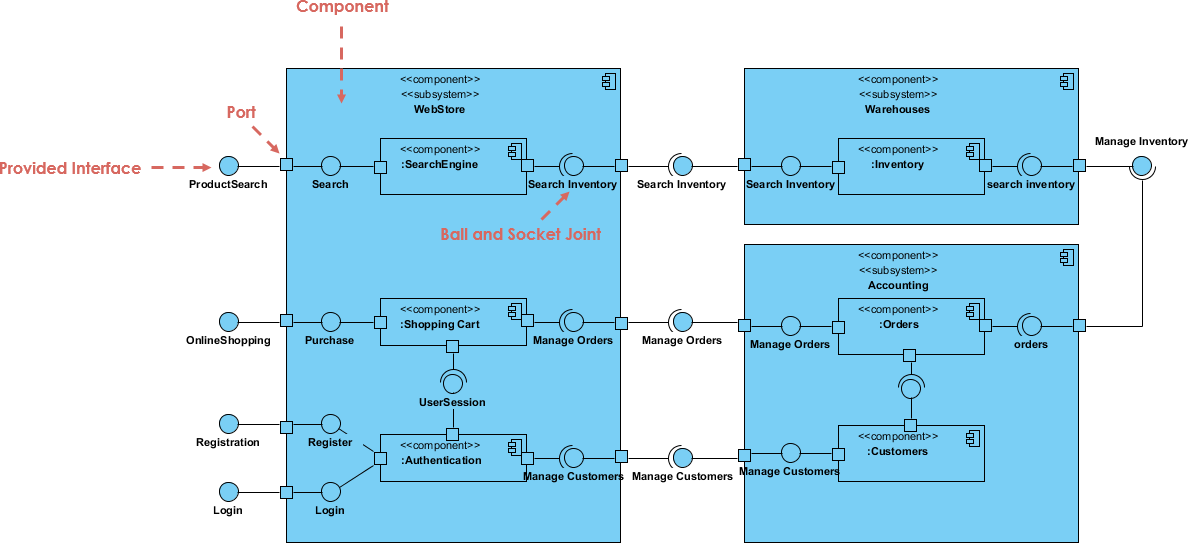
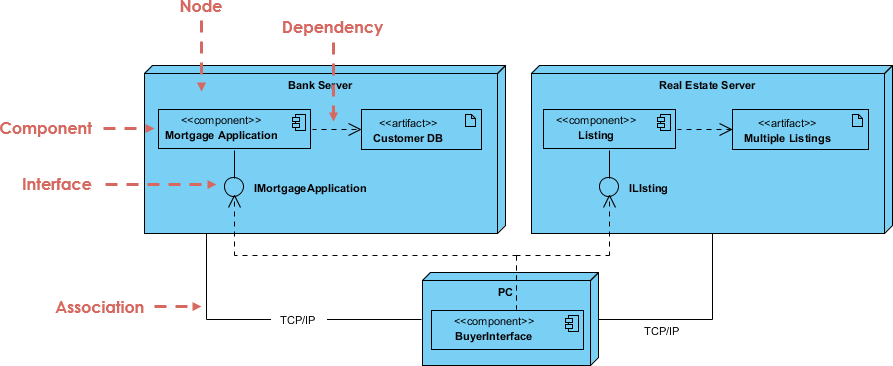
Here is a component diagram example. Component diagram shows components, provided and required interfaces, ports, and relationships between them. This type of diagrams is used in Component-Based Development (CBD) to describe systems with Service-Oriented Architecture (SOA).

The following nodes and edges are typically drawn in a component diagram: component, interface, provided interface, required interface, class, port, connector, artifact, component realization, dependency, usage. These major elements are shown on the picture here.

Import into your Project
Open post

Deployment Diagram with Components

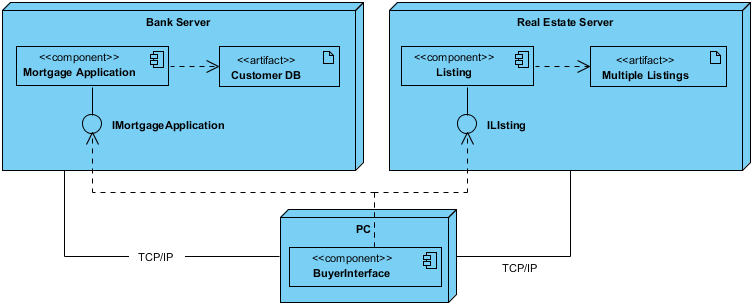
component is a code module. Component diagrams are physical analogs of class diagram. Deployment diagrams show the physical configurations of software and hardware. The following deployment diagram example shows the relationships among software and hardware components involved in real estate transactions.

The physical hardware is made up of nodes. Each component belongs on a node. Components are shown as rectangles with two tabs at the upper left.

Import into your Project

Posted by:

Open post

Swimlane

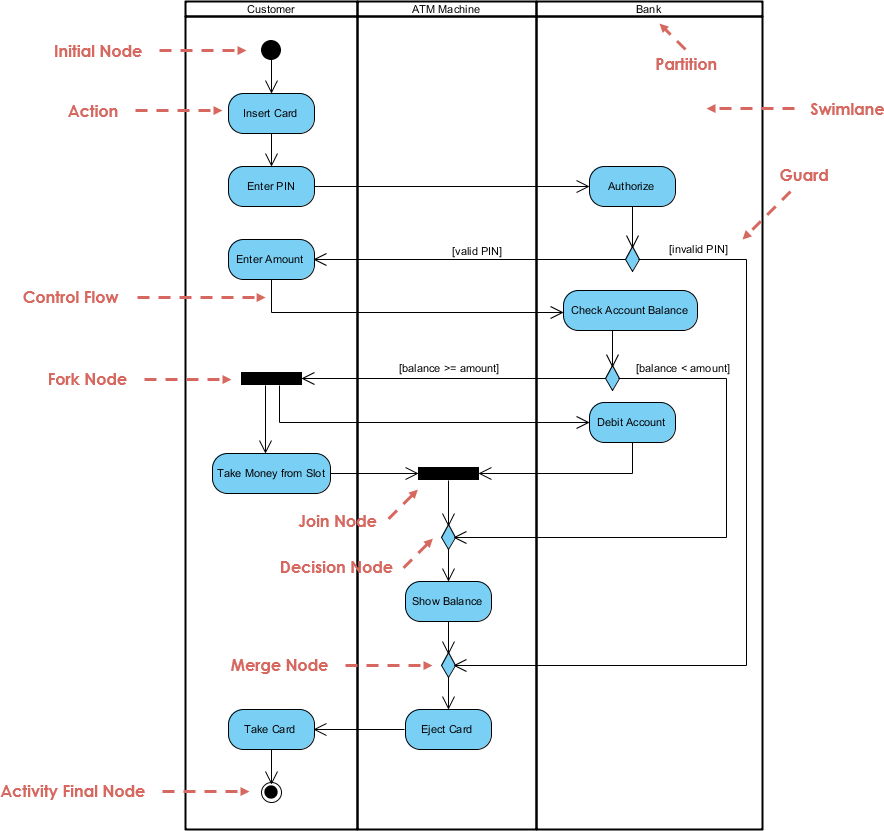
Here is an activity diagram example for ATM.

Withdraw money from an ATM Account - The three involved classes (people, etc.) of the activity are Customer, ATM, and Bank. represented swimlanes that determine which object is responsible for which activity. The process begins at the black start circle at the top and ends at the concentric white/black stop circles at the bottom. The activities are rounded rectangles.

A single transition comes out of each activity, connecting it to the next activity, which may branch into two or more mutually exclusive transitions. Guard expressions (inside [ ]) label the transitions coming out of a branch. A branch and its subsequent merge marking the end of the branch appear in the diagram as hollow diamonds. A transition may fork into two or more parallel activities. The fork and the subsequent join of the threads coming out of the fork appear in the diagram as solid bars.

Import into your Project
Open post

Hotel Reservation

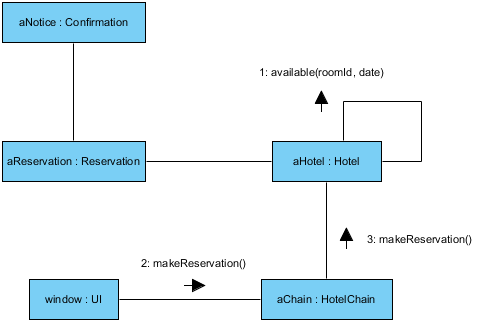
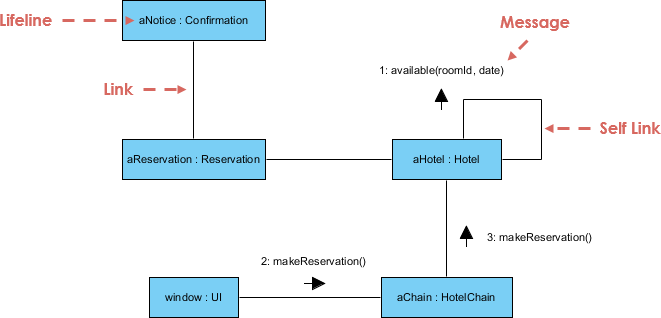
Here is a communication diagram example.

Communication diagrams are also interaction diagrams. They convey the same information as sequence diagrams, but they focus on object roles instead of the times that messages are sent. In a sequence diagram, object roles are the vertices and messages are the connecting links.

The object-role rectangles are labelled with either class or object names (or both). Class names are preceded by colons ( : ). Each message in a collaboration diagram has a sequence number. The top-level message is numbered 1. Messages at the same level (sent during the same call) have the same decimal prefix but suffixes of 1, 2, etc. according to when they occur.

Import into your Project

Posted by:

Open post

Sequence Diagram Example

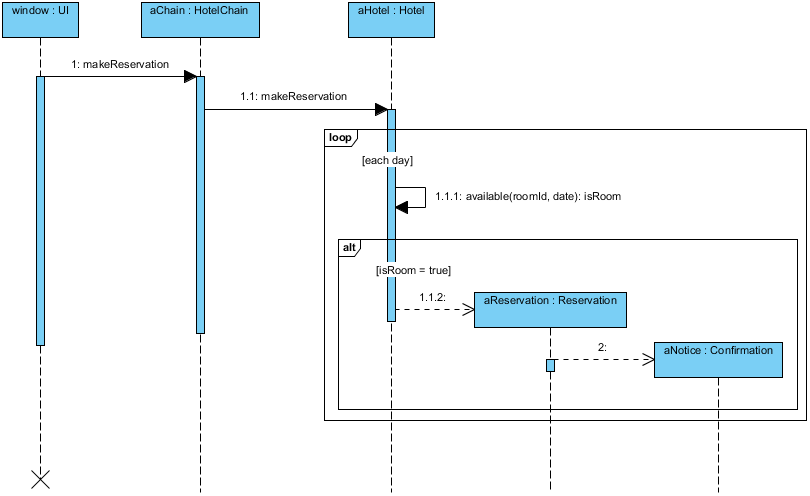
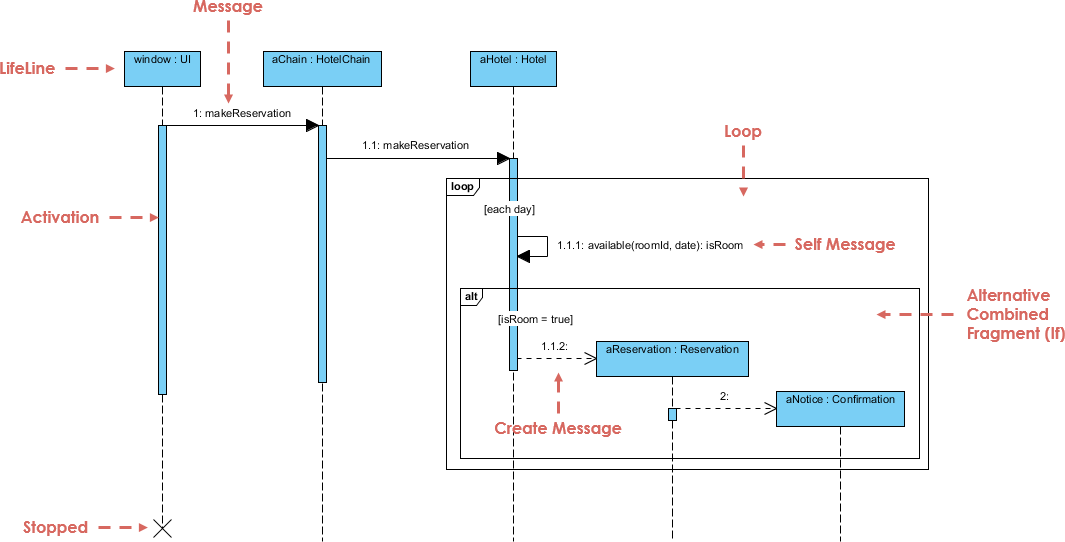
Sequence Diagram is an interaction diagram that details how operations are carried out -- what messages are sent and when. Sequence diagrams are organized according to time. The time progresses as you go down the page. The objects involved in the operation are listed from left to right according to when they take part in the message sequence.

Note That: Class and object diagrams are static model views. Interaction diagrams are dynamic. They describe how objects collaborate.

Here is a sequence diagram example for making a hotel reservation. The object initiating the sequence of messages is a Reservation window.

Import into your Project
Open post

MVC Framework

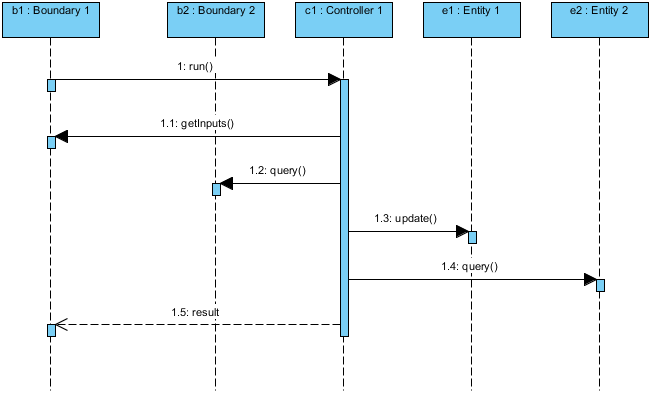
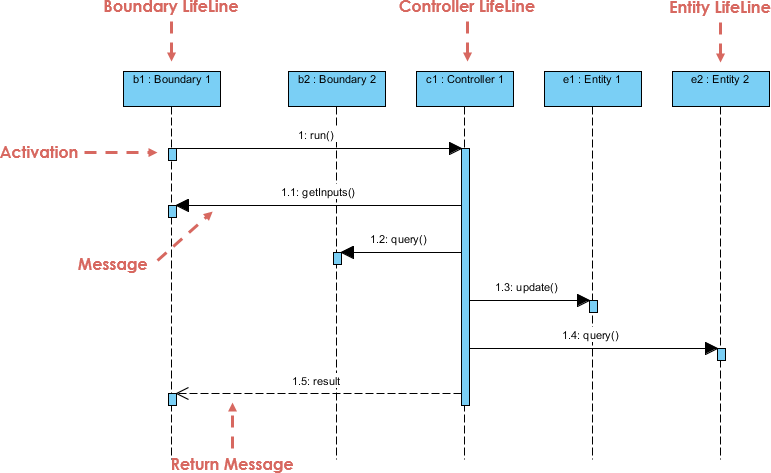
Here is a sequence diagram example.

  • Entities are objects representing system data: Customer, Product, Transaction, Cart, etc.
  • Boundaries are objects that interface with system actors: UserInterface, DataBaseGateway, ServerProxy, etc.
  • Controls are objects that mediate between boundaries and entities.

They orchestrate the execution of commands coming from the boundary by interacting with entity and boundary objects. Controls often correspond to use cases scenario and often represented by a sequence diagram.

Import into your Project

Posted by:

Open post

Analysis Stereotypes

There are three type of stereotypes:

  • An boundary often represent a user interface (GUI).
  • A controller is responsible for representing the business logic between boundary and data entity
  • An entity is a data object or persistent data object.

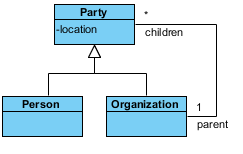
These three stereotypes are typically used for representing Model / View and Controller layered software framework pattern. Let's take a look at this class diagram for an example.

Import into your Project
Open post

Example Class Diagram vs Object Diagram

An object diagram is a snapshot of the objects in a system at a point in time. We can use an object diagram to show an example configuration of a snapshot from a class diagram. The figure shows the Class Diagram of Party Composition Structure and a particular snapshot at a point in time.

The object of the names are underlined and each name takes the form object name : class name. Both parts of the name are optional, so Robert and :Person are legal names. You can then show values for attributes and links in the object diagram and you can also think of an object diagram as a collaboration diagram without messages.

Import into your Project

Posts navigation

1 2 3 43 44 45 46 47