Open post

Top-down Work Package Estimation

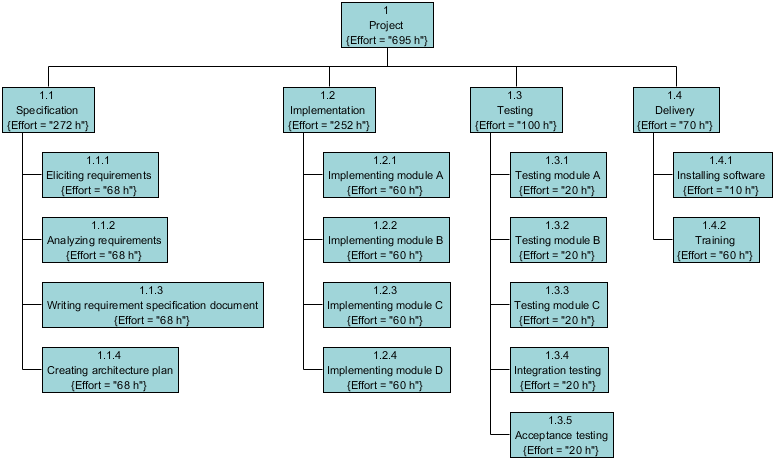
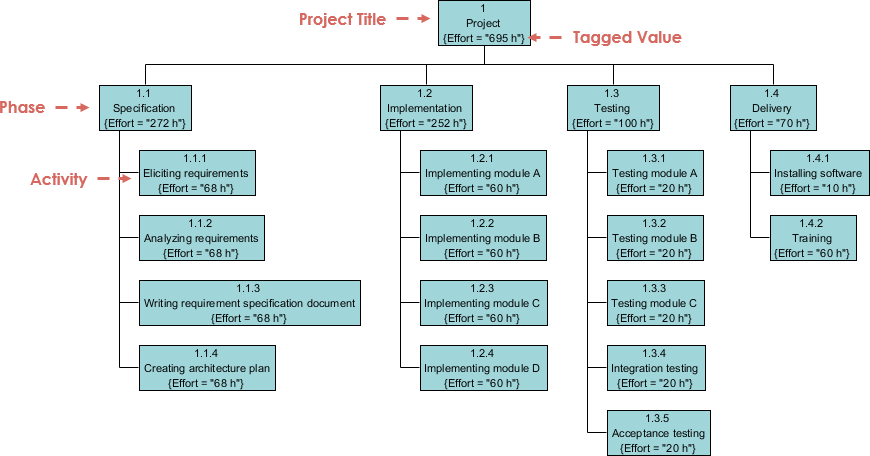
This is a quick work breakdown structure example.

Idea: Allocate proportions of an effort estimate to different activities of the project

Inputs: Main project activities (high level design) and earlier project data on efforts spent for activities

Outputs: Rough work breakdown with corresponding effort estimates

Advantages: Takes into account integration, configuration management and documentation costs (e.g. algorithmic models seldom take)

Disadvantages:  Underestimating the difficult low-level technical problems

Import into your Project
Open post

Prepare Project Proposal

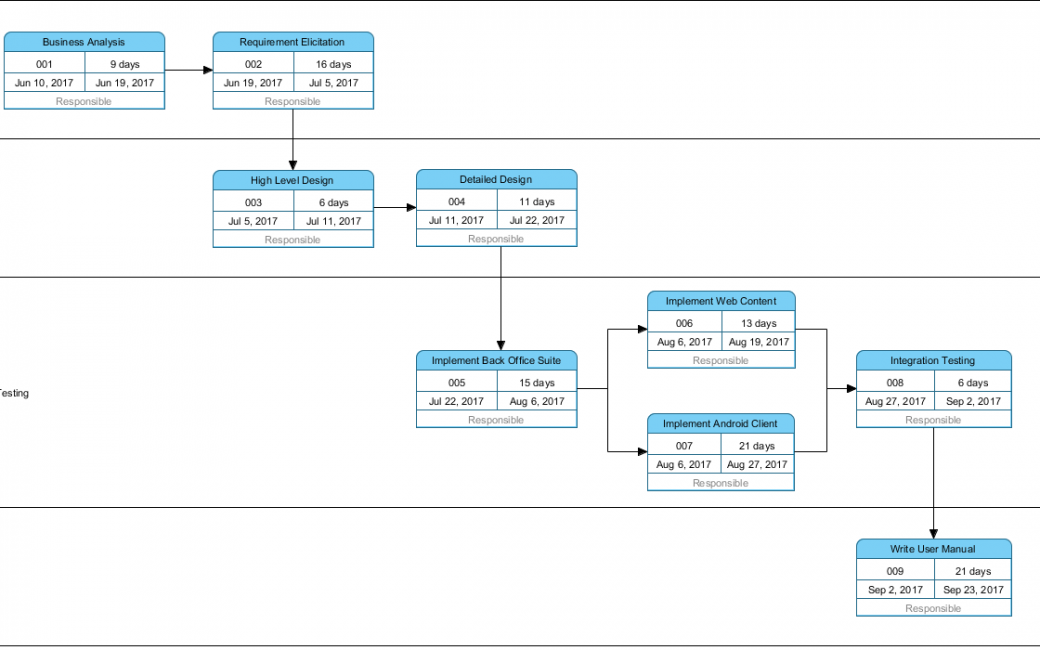
This is a PERT Chart example.

Suppose a systems analyst is trying to set up a realistic schedule for the data gathering and proposal phases of the systems analysis and design life cycle. The systems analyst looks over the situation and lists activities that need to be accomplished along the way, and formed a PERT Chart.

Import into your Project
Open post

Implementation Plan Diagram – Software Project

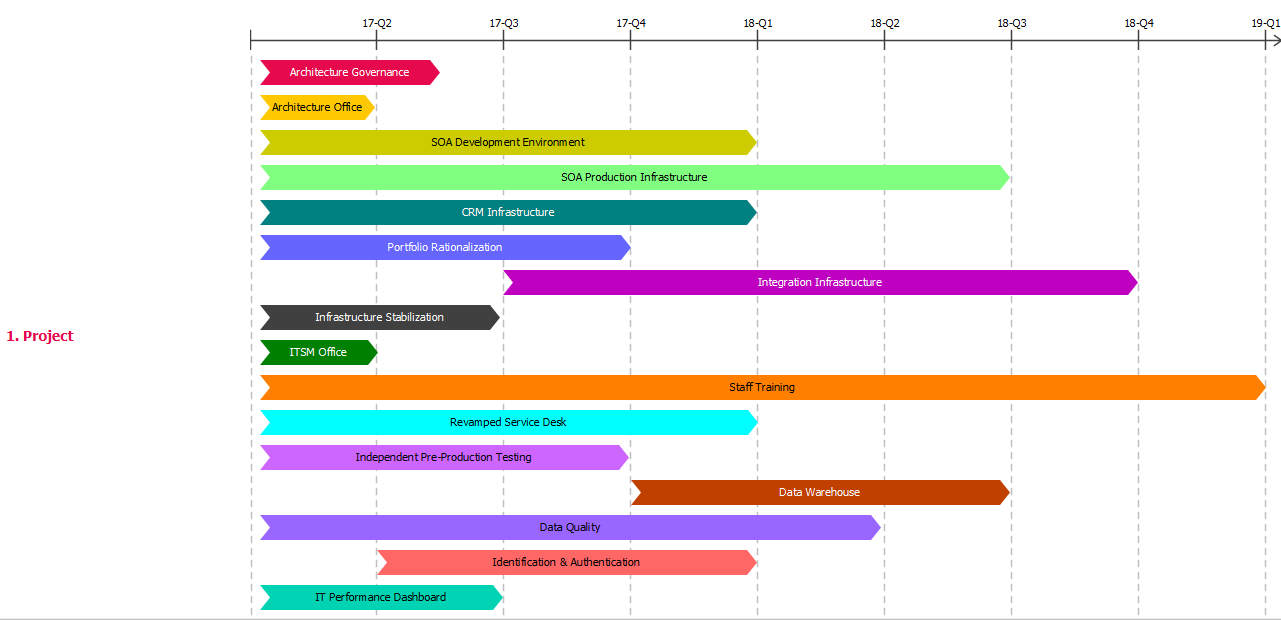
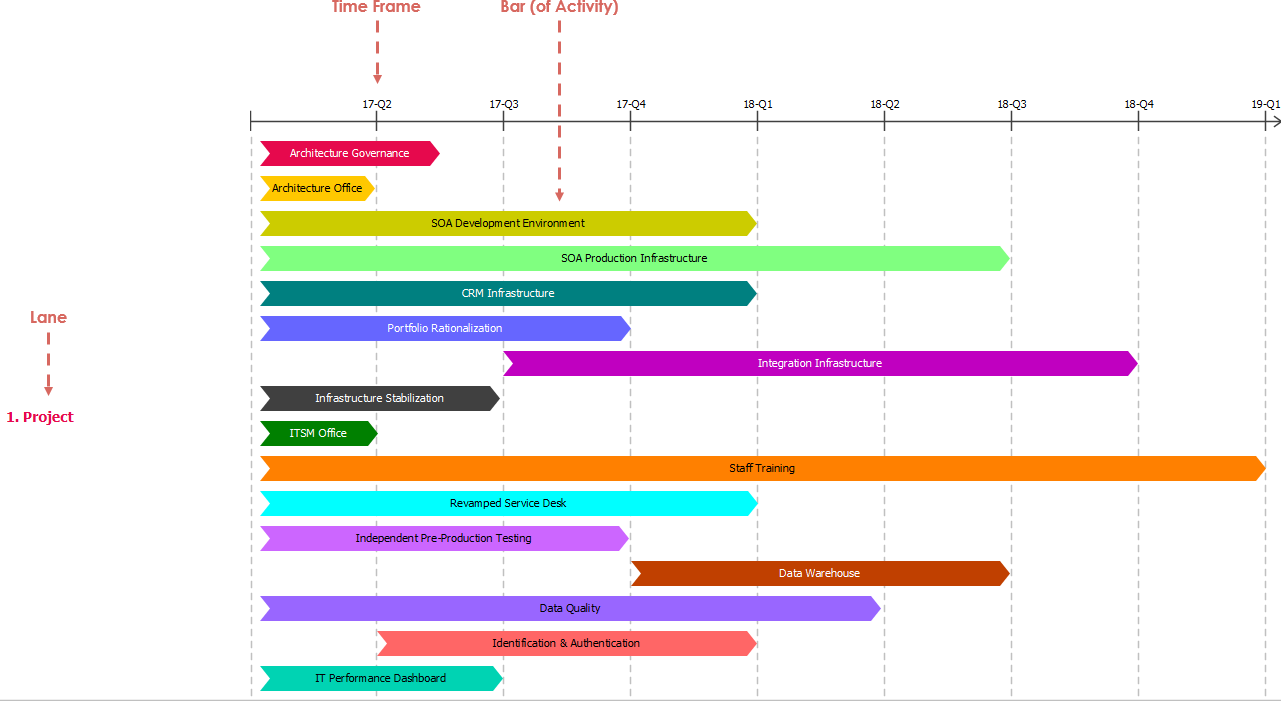
This is an example of software project roadmap.

Missed deadlines, forgotten milestones, and messy spreadsheets cut the motivation, and lead to lower work productivity. Working without a clear project plan will lead your team to a crossroad with no clear action plan. Project management timeline helps to set clear directions and priorities by keeping everyone will be on the same page. Your entire team knows which tasks need to be completed next, as the priorities have been set aside clearly in the first place. Thus, everyone's goals and objectives are likely agreed and aligned together. The example illustrates the implementation plan of a SOA software project for an enterprise architecture initiative

Import into your Project
Open post

TOGAF Maturity Analysis 2

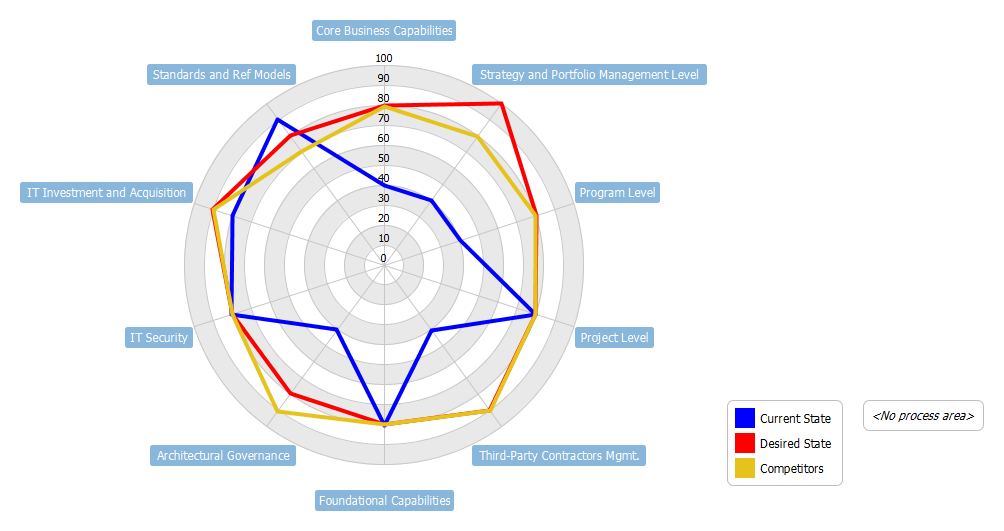
This example shows the use of radar chart in performing maturity analysis (the TOGAF way).

TOGAF advocates the use of maturity models as a tool to assess the current status of an organisation (within a predefined scope and process area(s)).  The clear mappings of the process maturity levels both at current and future states (or even including the competitors’ maturity level of references) make it an ideal tool to communicate the planned roadmap.

Graphical representation of the maturity levels can be easily recorded via spreadsheet as shown here.

Import into your Project
Open post

Eliminating Project Risks

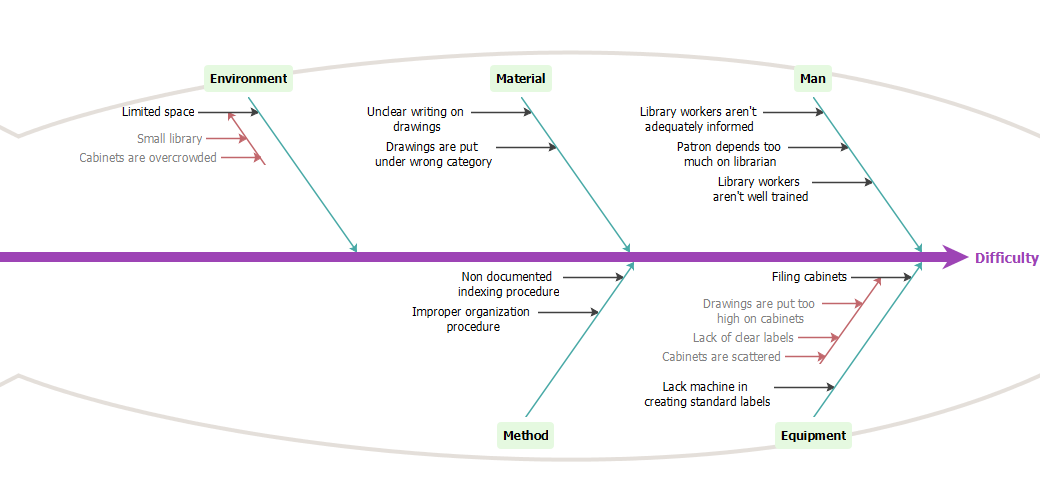
This is a Cause and Effect diagram that represents project risks.

Software could be associated with serious problems, the adoption of agile methods are not immune to such troubles. In order to identify what can go wrong in a project, a project team brainstorm with a cause-and-effect analysis also Ishikawa or fishbone diagram. The value of the analysis is to systematically list all the possible problems that any occur, such as schedule slips might be obvious, but others such as scope creep (the desire to add features after the analyst hears new stories) or developing features with little value are not as obvious.false

Import into your Project