A Data Flow Diagram (DFD) is traditional visual representation of the information flows within a system which are used to graphically represent the flow of data in an information system by describing the processes involved in transferring data from input to data storage and reports generation.
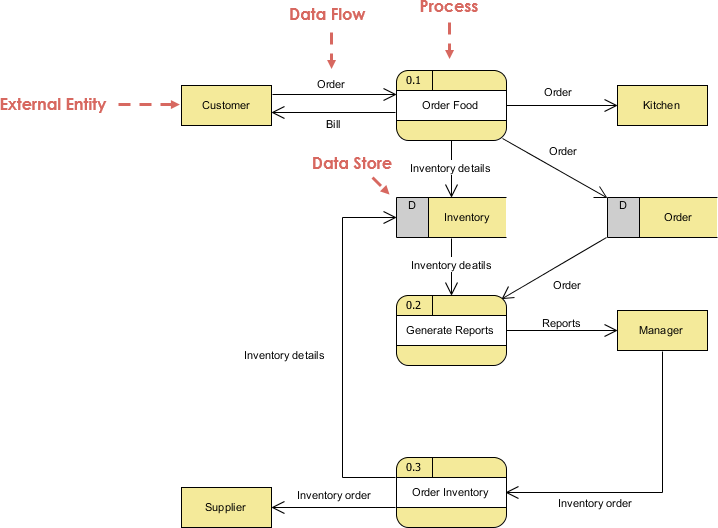
Through the use of data flow diagrams, a system can be decomposed into subsystems, and subsystems can be further decomposed into lower-level subsystems. In other words, data flow diagrams follow a hierarchy; that is, a diagram may consist of several layers, each unique to a specific process or data function and each subsystem represents a process or activity in which data is processed. Level 0 diagrams start at the most basic level, also known as the context level, and attempt to document systems as a whole. Analysts then drill down to the specifics of individual processes with level 1 diagrams.
Data flow diagrams are used by information technology professionals and systems analysts to document and show users how data moves between different processes in a system. Analysts generally start with an overall picture and then move on to the finer details of each process. A neat and clear DFD can depict a good amount of the system requirements graphically. It can be manual, automated, or combination of both. A DFD is often used as a preliminary step to create an overview of the system without going into great detail, which can later be elaborated.
Other DFD Resources