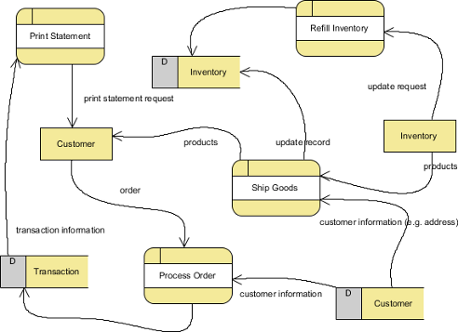
Data flow diagram is a well known approach to visualize the data processing in business analysis field. A data flow diagram is strong in illustrating the relationship of processes, data stores and external entities in business information system.
Creating data flow diagram
- Select Diagram > New from the application toolbar.
- In the New Diagram window, select Data Flow Diagram.
- Click Next.
- Enter the diagram name and description. The Location field enables you to select a model to store the diagram.
- Click OK.
Decomposing a process
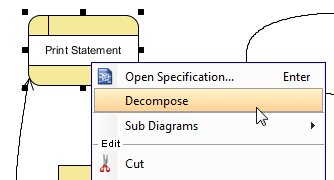
You can create multiple data flow diagrams for different levels of detail. A new level can be decomposed from a process in diagram. To decompose a process, right click on the process and select Decompose from the popup menu. In the sub-diagram you will see the in/out flows that allow you to connect the data flow from parent to sub-diagram. Click here you if you want to learn more about in/out flows.
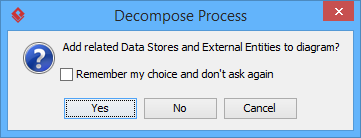
The Decompose Process dialog box will be prompted to ask you whether to add related data stores and external entities to the new data flow diagram. If you choose Yes, those connected data stores and external entities will be copied to the new diagram.