What is Data Flow Diagram?
A data flow diagram (DFD) is a graphical representation of the “flow” of data through an information system which can also be used for the visualization of data processing (structured design). It views a system as a group of functions that transform the input into desired output.
DFD vs Flowchart
There is a prominent difference between DFD and Flowchart. The flowchart depicts flow of control in program modules. DFDs depict flow of data in the system at various levels. DFD does not contain any control or branch elements. The flowchart describes boxes that describe computations, decisions, interactions & loops. It is important to keep in mind that data flow diagrams are not flowcharts and should not be used for modeling control flow logic.
DFD Notations
Process
- A rounded rectangle represents a process
- Processes are given IDs for easy referencing
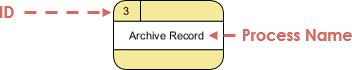
Process Example
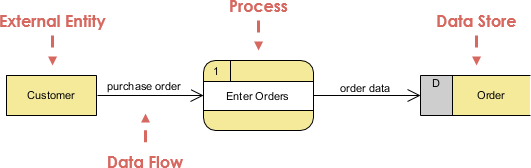
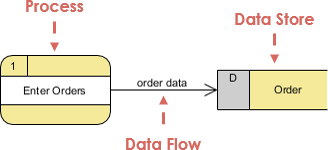
Data Flow
A data-flow is a path for data to move from one part of the information system to another. A data-flow may represent a single data element such the Customer ID or it can represent a set of data element (or a data structure).
Example:
- Customer_info (LastName, FirstName, SS#, Tel #, etc.)
- Order_info (OrderId, Item#, OrderDate, CustomerID, etc.).
Data flow Example
- Straight lines with incoming arrows are input data flow
- Straight lines with outgoing arrows are output data flows
Steps for Creating Data Flow Diagrams
- Identify external entities involved in the system
- Create the DFD context diagram template
- Create a list of activities
- Construct Context Level DFD by identifying sources and sink)
- Construct Level 0 DFD by identifying manageable sub processes
- Construct Level 1- n DFD – by identifying actual data flows and data stores
Data Flow Diagram Example
The operations of a simple hotdog stand will be used to demonstrate the creation of data flow diagrams:
Step 1 – Identify external entities involved in the system
- Customer
- Employee
- Supplier
Step 2 – Create DFD context Diagram Template
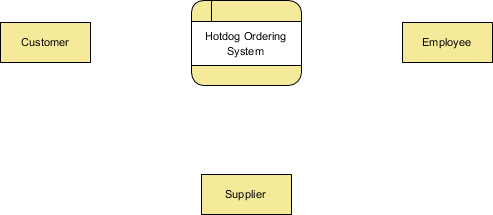
Step 3 – Create a list of activities by thinking through the activities that take place at a hotdog stand between the system and external entities.
- Customer
- Customer Order
- Serve Product
- Collect Payment
- Employee
- Produce Product
- Store Product
- Order Raw Materials
- Supplier
- Pay for Raw Materials
- Pay for Labor
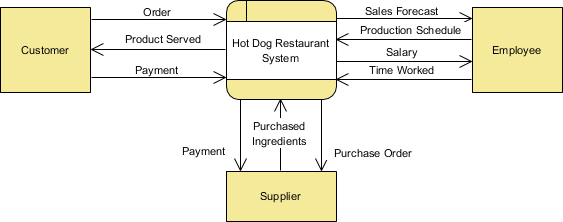
Step 4 – Construct Context Level DFD by identifying sources and sink
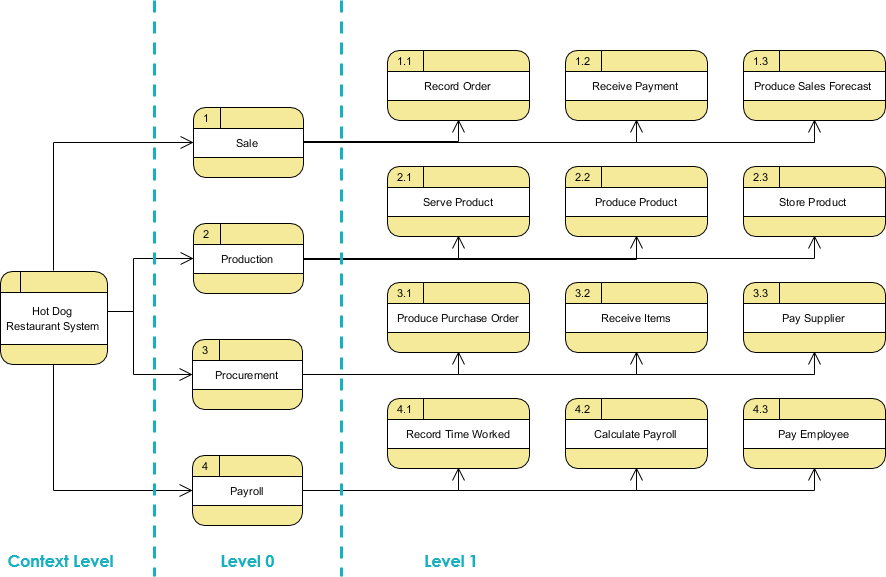
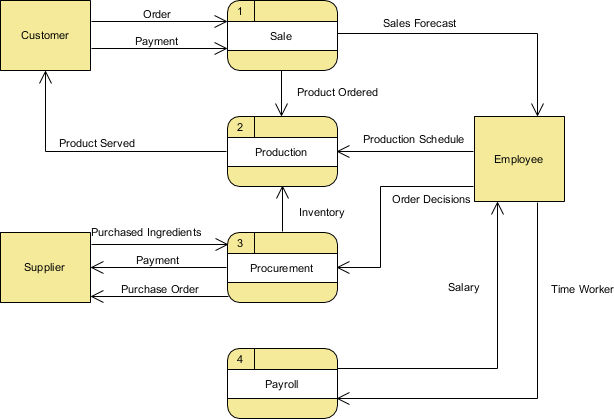
Step 5 – Construct Level 0 DFD by identifying manageable sub processes
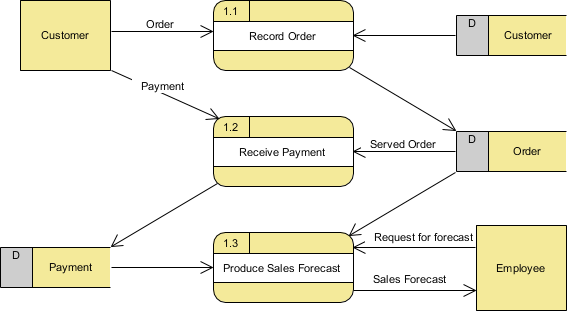
Step 6 – Construct Level 1- n DFD – by identifying actual data flows and data stores
6.1 Refinement of 1.0 Sale subprocess
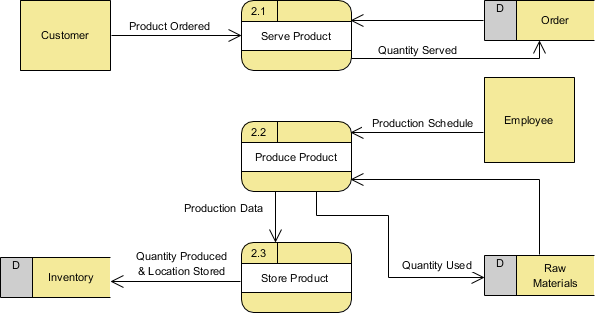
6.2 Refinement of 2.0 Production subprocess
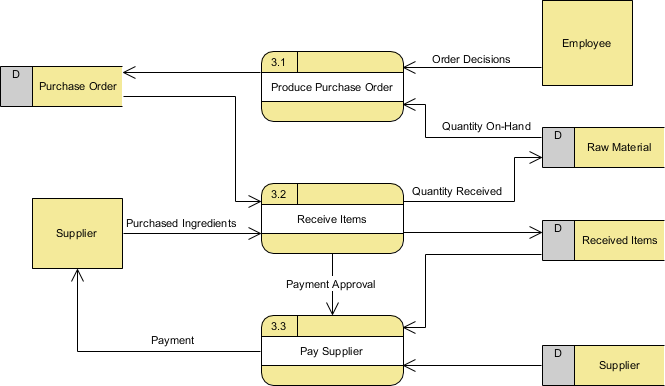
6.3 Refinement of 3.0 Procurement Subprocess
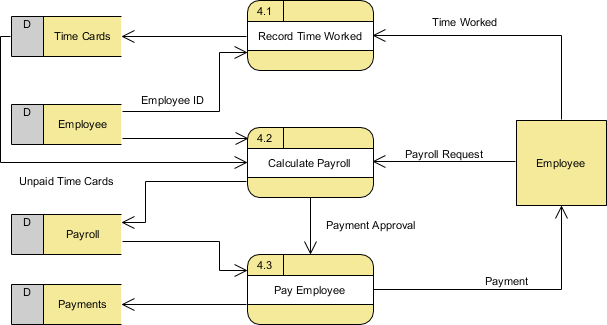
6.4 Refinement of 4.0 Payroll subprocess
DFD Top-down Decomposition Process