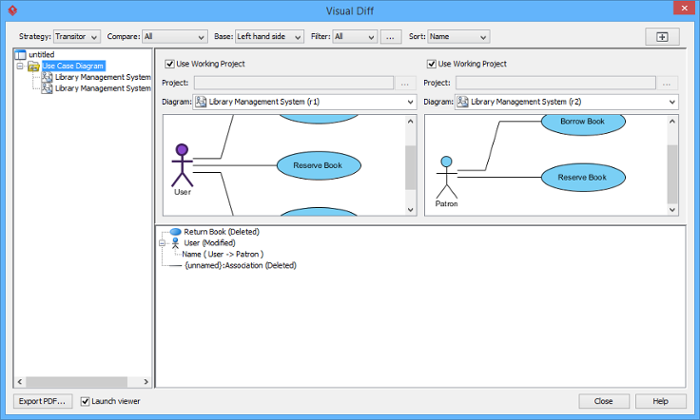
The situation of comparing two diagrams is common. For example, compare an ERD of conceptual model with an ERD of physical model and comparing a domain class diagram with a class diagram ready for implementation. Visual Paradigm allows you to compare the differences between diagrams in order to trace the changes between them.
Diagram comparison
With the feature of Visual Diff, two diagrams can be compared to recognize their differences. Changes, such as modification of properties (e.g. name) and addition/removal of containing models can thus be found easily.

Various comparison strategies
A comparison strategy determines how two diagrams will be compared. Each strategy is used for its own specific purpose. You can select the appropriate strategy that suits your case most. The following is the description of strategies:
| Strategy | Description |
|---|---|
| ID | Shapes will be matched base on their internal ID. Differences between shapes that have same ID will be displayed in the result pane. This strategy is usually used to visualize the changes of same shapes in two projects. |
| Name | Shapes will be matched base on their names. This strategy is useful when visualizing differences for external works. One of typical examples is to compare databases and class models. |
| Transitor | Shapes will be matched base on their transition established by Model Transitor. This way of comparison is usually used to visualize the differences between model elements. |
Comparing view only, model element only, or both
Comparison is divided into view, model element and both of them. The selected option from the drop-down menu of Compare determines the display for comparison. By selecting View, the differences in view settings, such as the coordination of shapes will be considered as changes. By selecting Model Element, the differences in model element level, such as their names will be considered as changes. By selecting All, the differences in both view settings and model element level are displayed.

Comparing from the left to the right and vice versa
Comparisons are made between two diagrams, which are put on the left and the right hand side in the Visual Diff window respectively. By default, comparison is based on left hand side, which means that if a shape does not exist on the left hand side but on the right hand side, the shape will be considered as newly added in the result pane. The base can be swapped from the right to the left and vice versa. By doing so, the absence of shape on the left hand side will result in a document of deleted shape.
 |
| Changing the base to “Right hand side” |
Sorting the data on result pane
The selected option from the drop-down menu of Sort determines the order of data on the result pane. You can select sort by type, by name or by change type.
Exporting a document of differences
A document of the current comparing diagrams can be saved in your computer as PDF. Click Export PDF… button at the bottom left corner of the window. Select a directory for storing in Export PDF dialog box and then click Save button.