Competitive analysis is the process to identify and evaluate your competitors' strengths and weaknesses relative to those of your own product or service. The evaluation should give you a better understand of you and your competitors, which helps you position your company better to play up your strengths and their weaknesses.
Radar chart is a graphical way to compare data by displaying data in a "web-like" form looking like spider web. The radar chart is a graphical method of displaying data in the form of a two-dimensional chart of three or more variables represented on axes starting from the same point.
Radar charts are particularly useful when examining several factors that are related to one item, thus, not only you can apply this Wizard for performing competitor analysis, but also many other strategic analysis such as, capability analysis, as-is / to-be analysis and etc.
Objectives
- Clearly displays the important categories
- Clearly defines full performance in each category.
- Makes concentrations of strengths and deficiencies visible.
- Automatic transform data in to well organized tabular format for further actions and comments.
Main Steps
- In this STEPS Wizard, you are required to develop a radar chart to identify the relative strengths and weaknesses of your company and your competitors in the various performance criteria.
- After that, you have to study the gaps between you and your competitors, justify the gaps and suggest improvement plans.
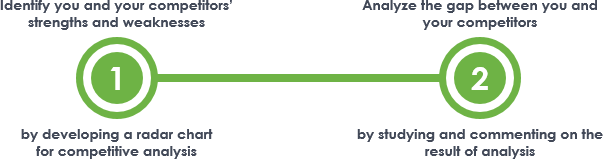
The figure above outlines the steps involved in performing competitive analysis with radar chart. In this article we will walk you through the steps in detail.
Try it in Visual Paradigm
Before we continue, if you are using Visual Paradigm you can click the button below to import this tutorial into Visual Paradigm and perform the steps in the form of a wizard.
Open this Wizard in Visual ParadigmStep 1: Develop a radar chart for competitive analysis
In this step, you are required to develop a radar chart to identify the relative strengths and weaknesses of your company and your competitors in the various performance criteria. Complete the items below to finish this step:
- Identify your main competitors (Try to restrict the pool to not more than 5 competitors. Having too many competitors will result in a radar chart that is over-complex and hard to read and study)
- Identify the criteria that you will use to determine how good each company is. Cost, revenue and customer satisfaction are typical examples of criteria.
- Create a radar chart by adding the competitors and criteria into the chart. Give a score for each criteria for each company being evaluated, on a scale of 0 to 100.
The steps below shows you how to develop a radar chart:
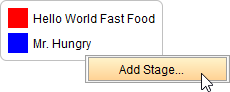
1. List your company and your competitors as stages. To rename a stage, double click and enter a new name. To create a stage, right click on the 'stage box' and select Add Stage... from the popup menu. If you want to change the color of line to appear in the chart, right click on the color label and choose Select Color... from the popup menu to make a color selection.
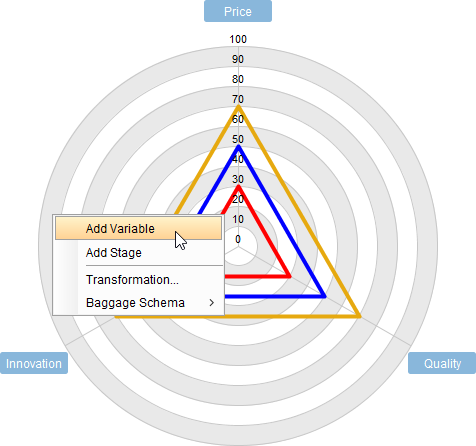
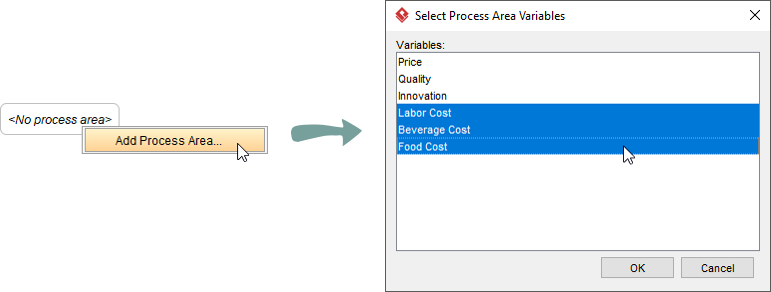
2. List the criteria to compare as variables. To insert a new criteria, right click on the chart and select Add Variable from the popup menu. To move a criteria, right click on it and select Move Anticlockwise or Move Clockwise from the popup menu.
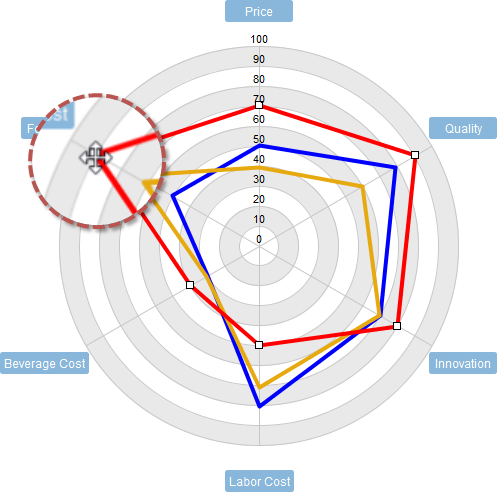
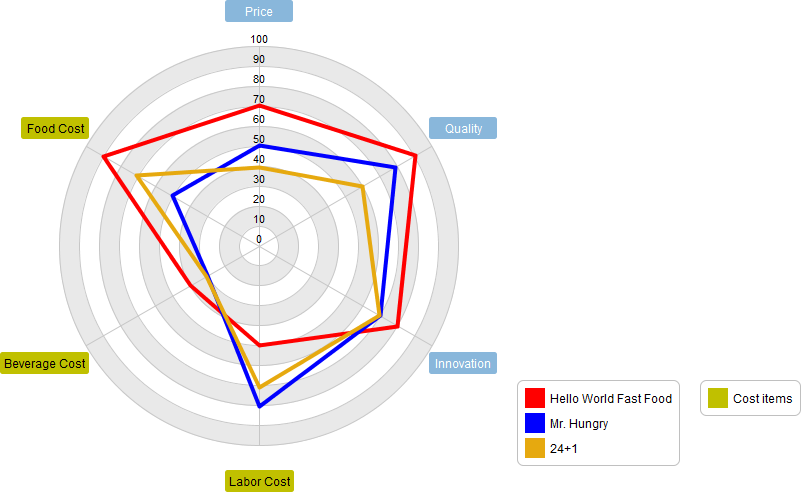
The result should look like this:
Step 2: Analyze the gap between you and your competitors
The difference between you and your competitors, known as gaps, are identified from the radar chart. In this step, you are required to comment on the gaps. Here are some questions that may help you in writing a comment:
- If you are falling behind your competitor,
- Why is it happening? Is it known and expected?
- Will there be any mitigation / rectification activities? What will happen if such activities are (not) going to be performed?
- If you beat your competitors,
- Why is it happening?
- Is the advantage sustainable?
- If not, will you take any action to improve it?
- Aside from the analysis of gaps, are there any business opportunities that you can identify during the evaluation?
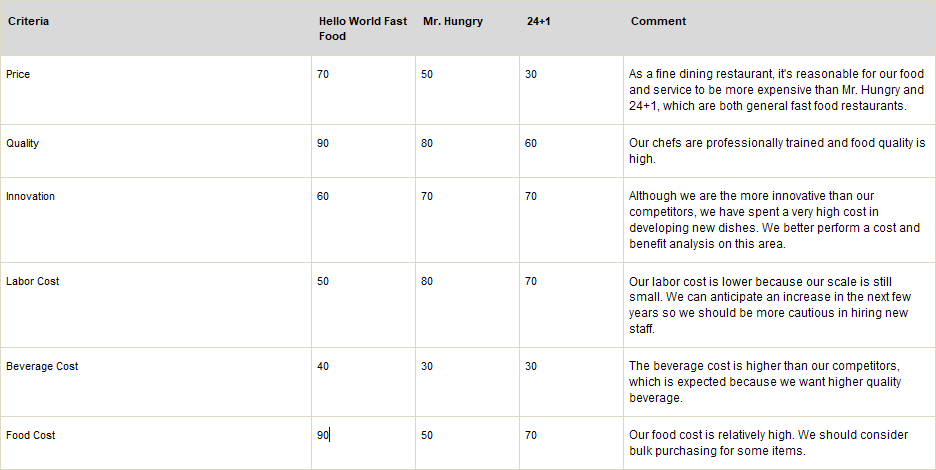
The figure below shows you an example of table that contains the result of analysis and comments to the gap.
Ready to try?
Click the button below to import this tutorial into Visual Paradigm and start developing MVC Sequence Diagrams for your system. The wizard not only provides the steps and guidance but also automates the transition of data among steps.
Open this Wizard in Visual Paradigm
Import into your Project
Open diagram in Visual Paradigm [?]Copy the URL below, paste it in the Open Project windows of Visual Paradigm and press Enter to open it |