Open post

Food Ordering System

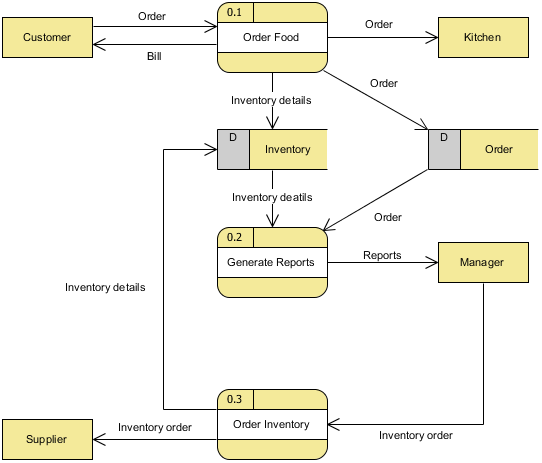
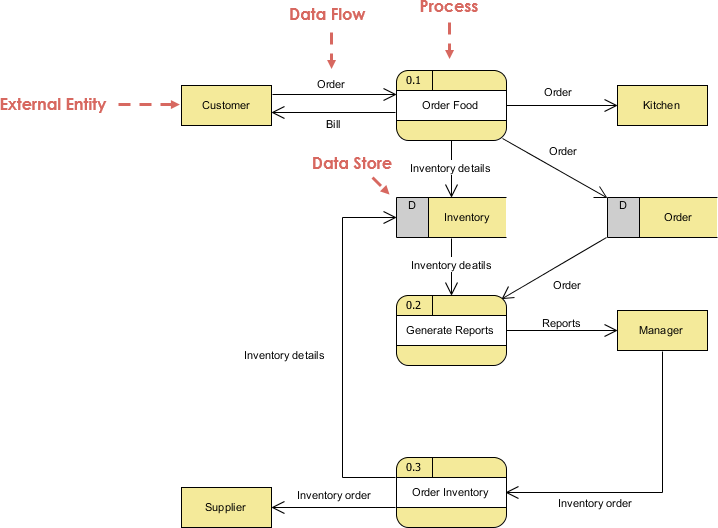
The next stage (See Previous Stage) is to create the Level 1 Data Flow Diagram. This highlights the main functions carried out by the system. As a rule, we try to describe the system using between two and seven functions - two being a simple system and seven being a complicated system. This enables us to keep the model manageable on screen or paper.

We must break up the single process into its sub-processes. The DFD example here shows the level 1 DFD, which is the decomposition (i.e. break down) of the Food Ordering System process shown in the context DFD.

Import into your Project

Posted by:

Open post

Food Ordering System (Context DFD)

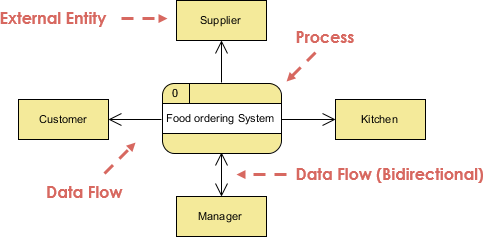
A DFD context diagram is a data flow diagram that only shows the top level, otherwise known as Level 0. At this level, there is only one visible process node that represents the functions of a complete system in regards to how it interacts with external entities. Context DFD is the entrance of a data flow model. It contains one and only one process and does not show any data store.

The DFD example here shows a context Data Flow Diagram that is drawn for a Food Ordering System. It contains a process (shape) that represents the system to model, in this case, the "Food Ordering System". It also shows the participants who will interact with the system, called the external entities. In this example, SupplierKitchenManager and Customer are the entities who will interact with the system. In between the process and the external entities, there are data flow (connectors) that indicate the existence of information exchange between the entities and the system.  Also see the next stage of Level 1 Data Flow Diagram

Import into your Project

Posted by:

Open post

Project Planning

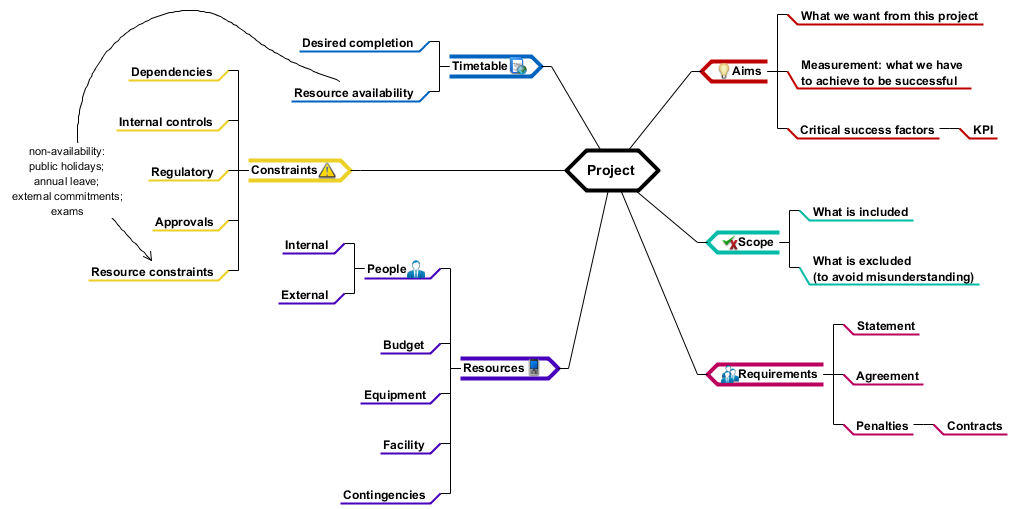
Here is a mind map diagram example. Here are the steps to develop a mind map:

  1. Create a Central Idea – The central idea is the starting point of your Mind Map and represents the topic you are going to explore. Your central idea should be in the centre of your page (in this example, Project Planning)
  2. Add branches to your map - The main branches which flow from the central image are the key themes. You can explore each theme or main branch in greater depth by adding child branches.
  3. Color code your branches - The color code allows you to categorize, highlight, analyse information and identify more connections which would not have previously been discovered.
  4. Include icons - Images have the power to convey much more information than a word, sentence or even an essay. They are processed instantly by the brain and act as visual stimuli to recall information.
Import into your Project

Posted by:

Open post

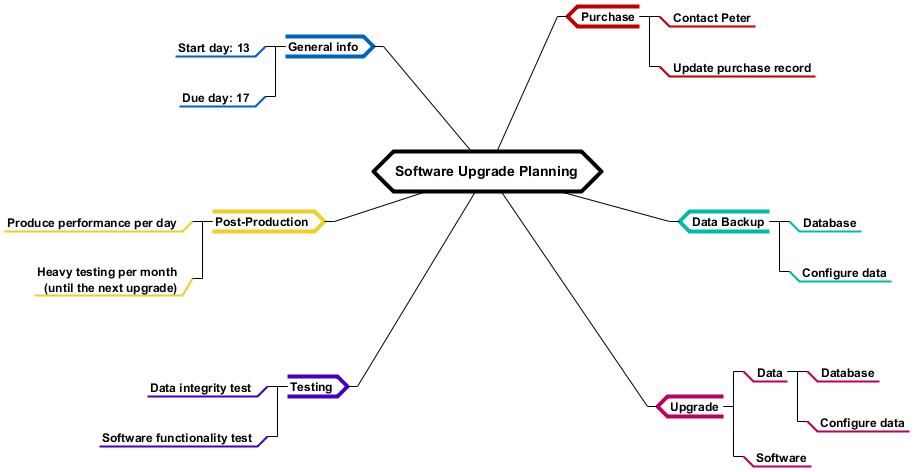
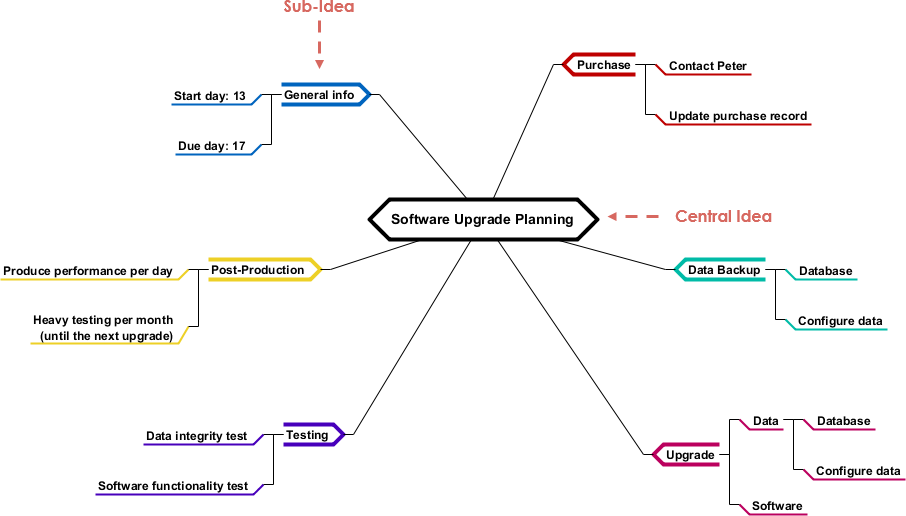
Software Upgrade Planning

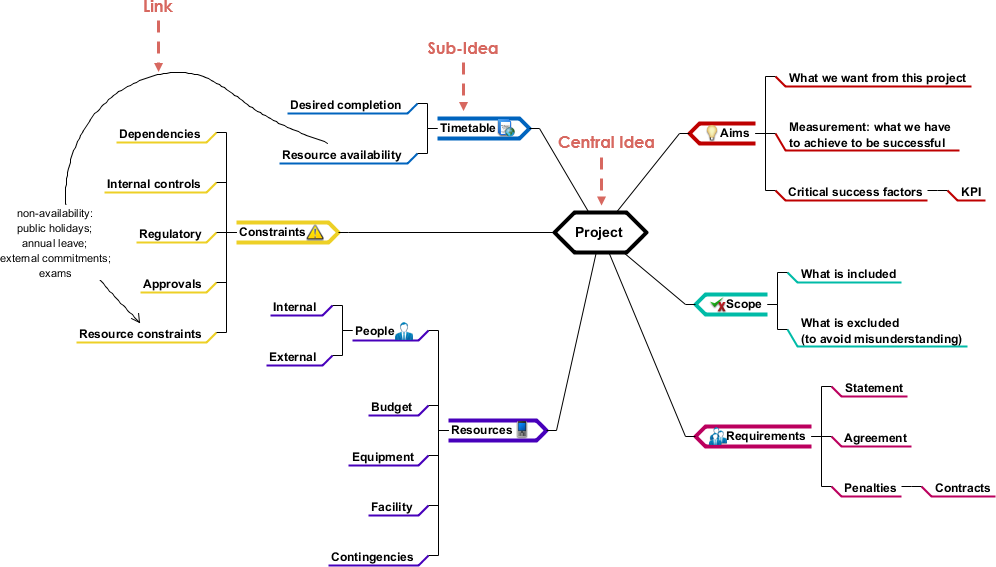
A Mind Map is a powerful graphic technique which provides a universal key to unlock the potential of the brain. It is an easy way to brainstorm ideas systematically without worrying about order and structure, which can be applied to every aspect of life where improved learning and clearer thinking will enhance human performance.
It allows you to visually structure your ideas to help with analysis and recall, and thus a mind map can turn a long list of monotonous information into a colorful, memorable and highly organized diagram that works in line with your brain's natural way of doing things.

In the mind map example here, the mind map illustrates how to use tasks, time, duration, concepts, or software items to linked to the central concept - Software Upgrade Planning using a non-linear graphical layout, which is a problem planning to be solved.

Import into your Project

Posted by:

Open post

Top-down Work Package Estimation

Here is a breakdown structure diagram example.

Idea: Allocate proportions of an effort estimate to different activities of the project

Inputs: Main project activities (high level design) and earlier project data on efforts spent for activities

Outputs: Rough work breakdown with corresponding effort estimates

Advantages: Takes into account integration, configuration management and documentation costs (e.g. algorithmic models seldom take)

Disadvantages:  Underestimating the difficult low-level technical problems

Import into your Project
Open post

Generic Product Structure

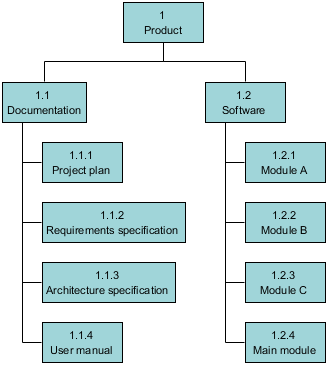
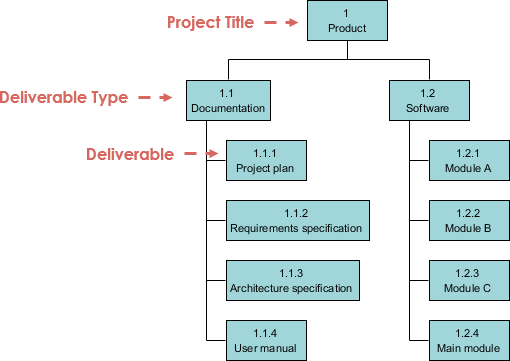
Here is a Product Breakdown Structure example. Product Breakdown Structure (PBS) is a similar construct as WBS, but is based on the structure of product rather than the type of activities.  Lower levels in PBS describe the structure of item on level above. The top level of PBS is the product. Second level may consist of the major components of the product. Lowest level should contain items that are "comprehensible".

Import into your Project
Open post

Software Project

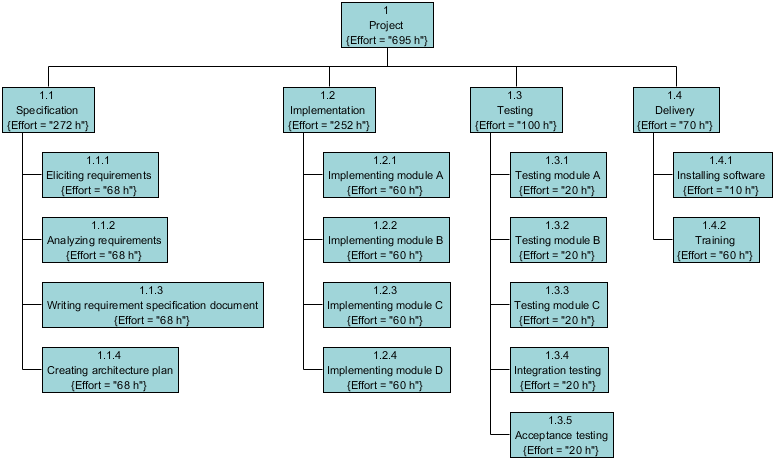
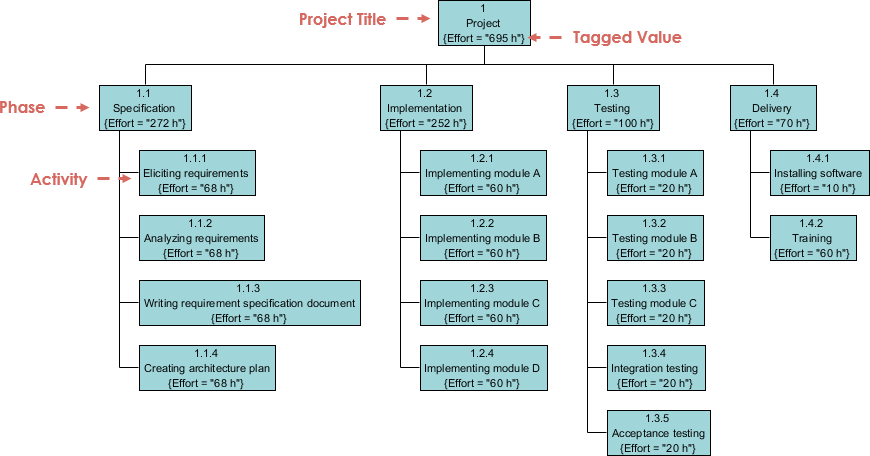
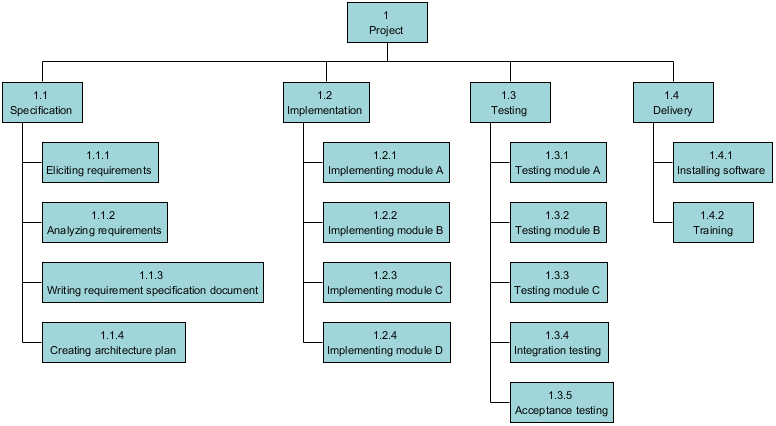
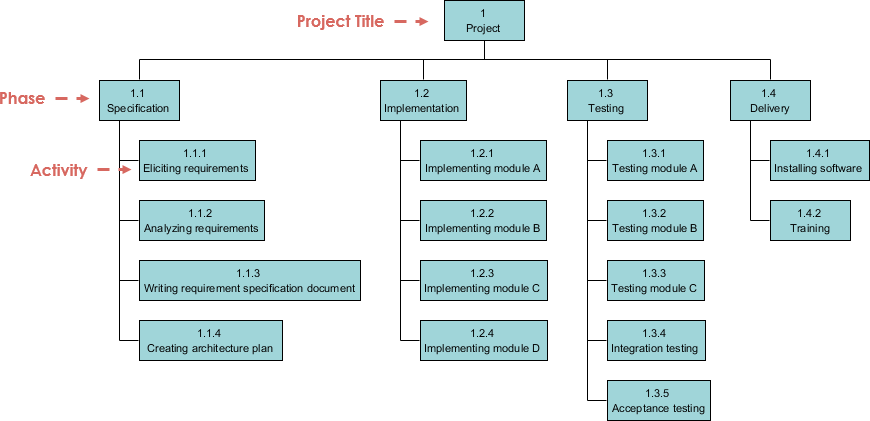
Here is a work breakdown structure example.

Work Breakdown Structure (WBS) is a graph (a tree) of activities done during the project.  Each activity is broken down into tasks, until desired level of detail is reached. A task must contain work related only to their parent activity. The top-level activity (= project) must contain 100% of work in the project. For each node, the sum of work shares in its sub-activities must be 100% . A desired level of detail for tasks is usually the size of task that can be allocated to a single person

Import into your Project
Open post

Generic Work Breakdown Structure

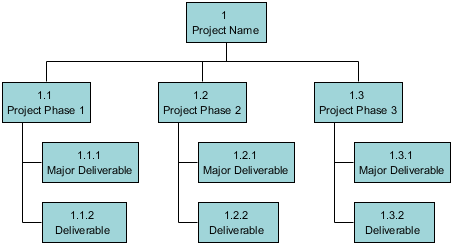
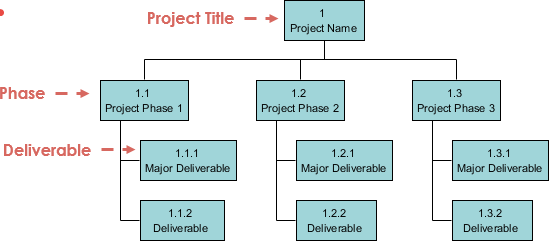
Here is a work breakdown structure diagram.

The work breakdown structure can be pictured like an organizational chart, with the highest level being the project itself, and the various levels under that consisting of increasingly more detailed breakdowns of the scope of the project. Although it can take the form of an organizational chart, it does not show who does the work, but simply displays the hierarchy of the various levels of decomposition of the scope.

This is a generic WBS template for kick-start the diagram

Import into your Project
Open post

Loss of Sales

Here is a cause and effect diagram example.

Created by Kaoru Ishikawa, a Japanese QA professional, who use this method to help his employees to avoid solutions that merely address the symptoms of a much larger problem. Ishikawa diagram, also called a cause and effect diagram or fishbone diagram, is a presentation and brainstorming tool for categorizing the potential causes of a problem in order to identify its root causes. Here we give an example on how the Fishbone Diagram is used in a real life problem.

Import into your Project
Open post

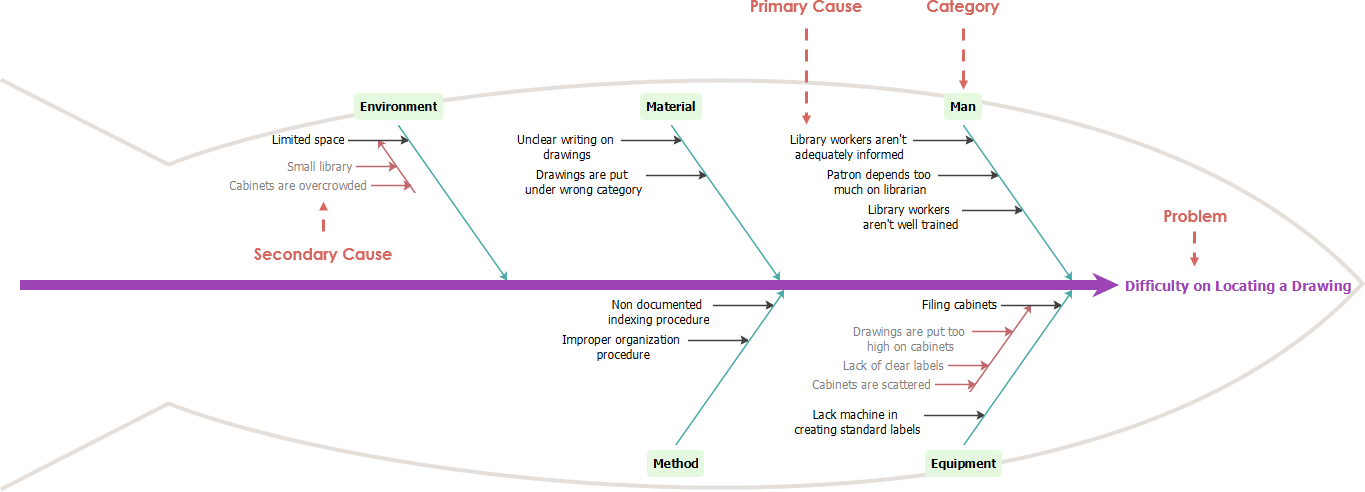
Difficulty on Locating a Drawing

Import into your Project

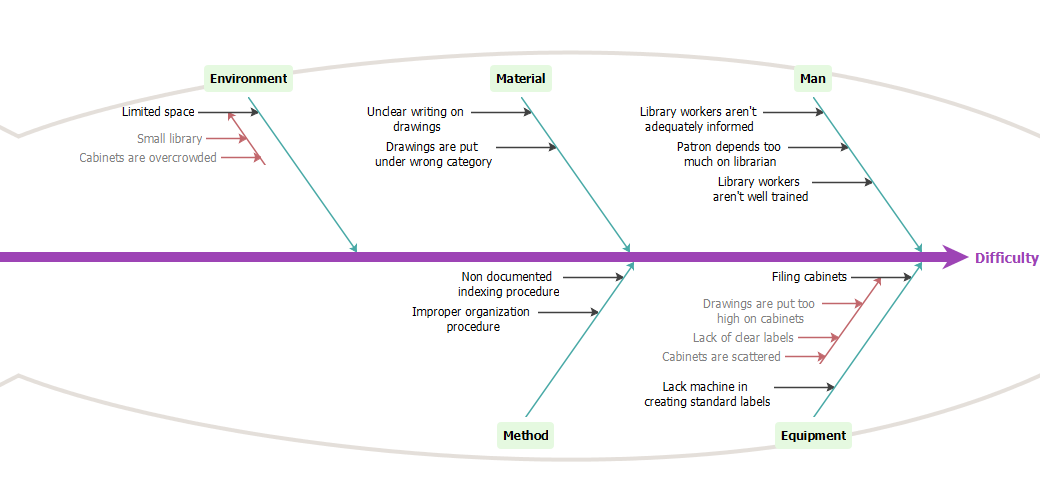
Here is a fishbone diagram example. The fishbone diagram is an analysis tool that provides a systematic way of looking at effects and the causes that create or contribute to those effects and it also known as the Cause and Effect Diagram or Ishikawa Diagram, is a graphical tool used to identify and explore on a single chart, in increasing detail, the possible causes which lead to a given effect. They are a structured framework that takes advantage of the collective knowledge of a team to identify the main causes of the effect under study. The ultimate aim is to work down, or drill-down, through the causes to identify basic root-causes of a problem. Here is an example of use of an Ishikawa diagram to solve a difficulty in locating a drawing.

Posts navigation

1 2 3 41 42 43 44 45 46 47