Author: vpadmin
")

")
Business Architecture (Organization Structure)


Solution Concept Diagram


Governance Structure


Impacted Organization Units


Employee Skill Analysis

Mobile Phone Comparison

Capability Analysis

Drawing Diagrams Online with Visual Paradigm’s Unique User Experience – with Zero Configuration!
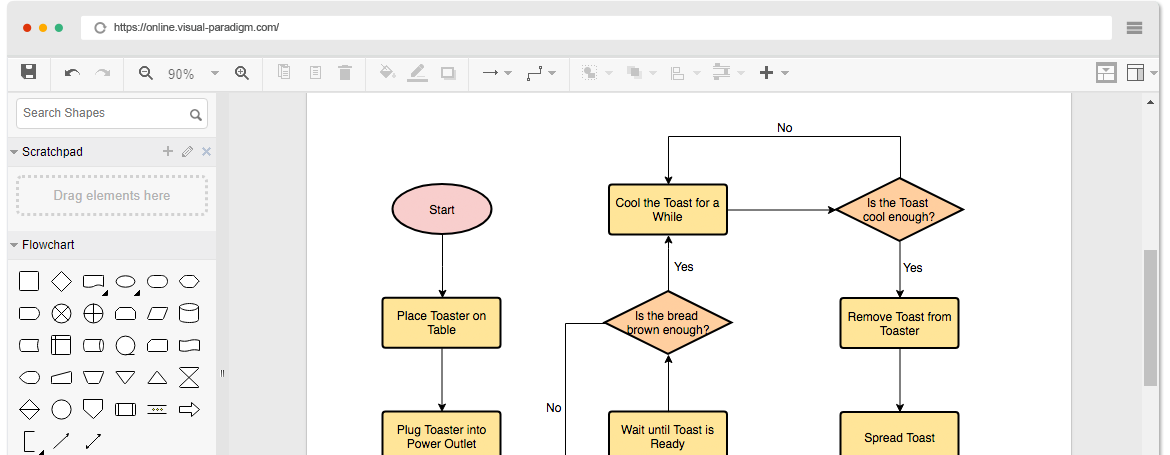
Simple and intuitive diagram editor
Creating professional drawing is easier than you think. With few drags, you get a beautiful and professional-looked drawing that can express your idea well.
One drag to create shape
Create shape and the line connecting it with just one drag. It’s direct, intuitive and time saving.
Alignment guide
The guides appear as you drag a shape on a diagram in alignment with another shape, helping you to place shapes precisely.

Friendly connectors
Connectors are automatically created when you create a shape from an existing one. No additional effort is needed to make connectors connected. And when a shape is being moved, the connectors that attached will be re-routed themselves to follow. Finally, there are over 40 kinds of connector and arrow heads that fit any kind of connectivity needs.
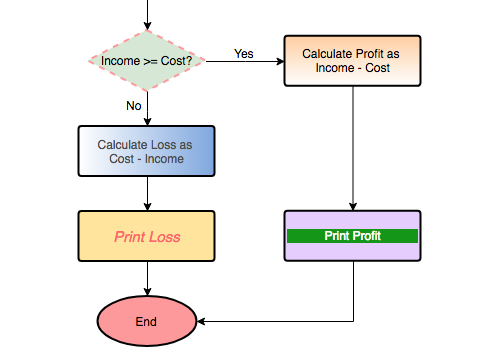
Powerful editing and formatting tools
Style your drawing to match your company’s corporate identity or your personal needs. VP Online supports a large set of editing functions, from standard functions like copy & paste, grouping, fill and line format, to advanced options like shape rotation, alignment, etc.
- Solid and gradient fill and line color
- Rotatable shapes
- Align and distribute shapes
- Rich text captions
- Grouping

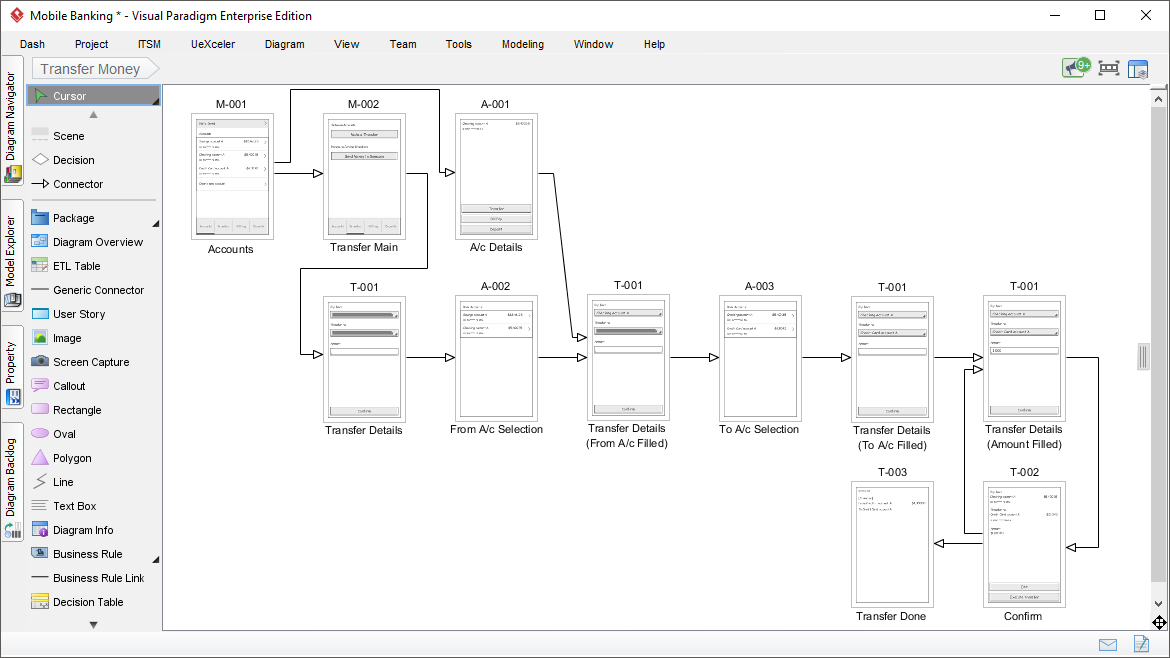
Combining the Power of Wireframing and Prototype into Your Hands?
Is it possible to put the power of wireframing and prototype into the hands UX Designers or Business Analysts? Unfortunately, most of the prototyping software are over-complicated that require strong IT technical background and programming knowledge… Visual Paradigm’s WireFlow diagram is specifically designed for people from non IT background. So what is the Visual Paradigm’s WireFlow feature anyway?
Wireframes is a widely adopted UX tool that allows UX designers and clients to work together in identifying the content and functionality of screens. A wireflow makes UX even more effective by harnessing the power of wireframe and flowchart, creating a step-based UX diagram that illustrates the steps and decision points of particular scenarios and the possible navigation paths throughout these steps.
The wireflow flowchart editor of Visual Paradigm allows fast creation of wireframe-based flowchart. Create flowcharts of any complexity and show them to your clients in both animation and print form.
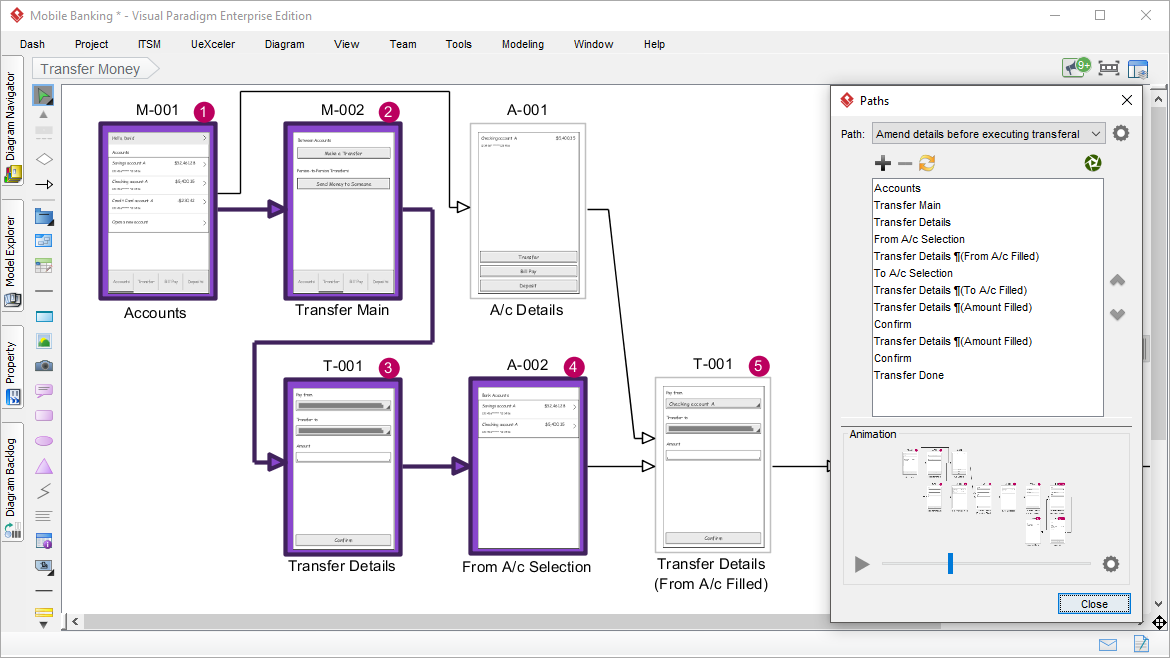
Animate path in action!
As long as a user interaction involves alternate and exceptional cases, there are multiple paths of wireflow that can be navigated. To reduce the application complexity, the wireflow editor allows you to specify a particular path (or often called scenario) of wireflow to be animated, so that we can split a user feature to be in sync with the partition of a simple user story or testing scenario. By this way, we can focus on some normal scenario of a features and in turns, the alternatives, making your development agile and just-in-time.
- Learn More about visual Paradigm’s wireflow Feature
- What’s New in Visual Paradigm