| Symbol | Description |
|---|---|
 |
|
|
|
|
|
|

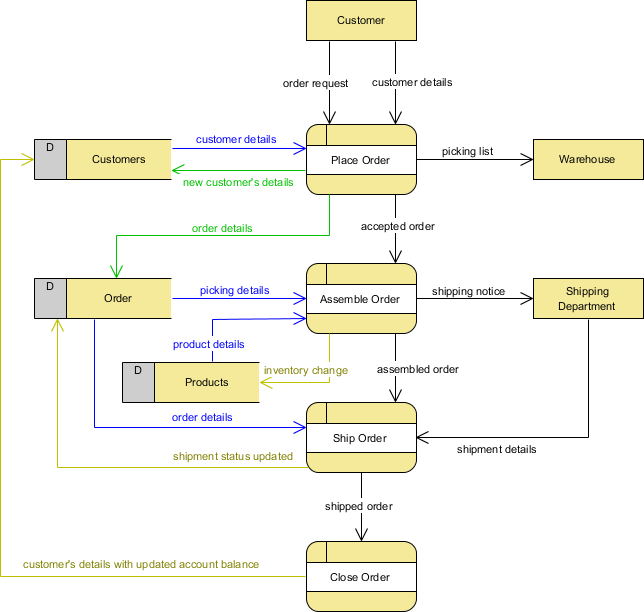
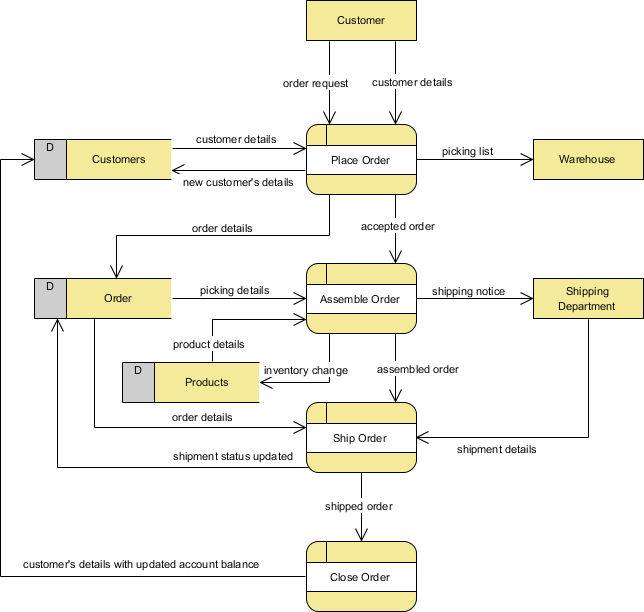
Data Flow Diagrams (DFD) are used to show the movement of data within a business information system. It visualizes the transfer of data between processes, data stores and entities external to the system. Data flow diagrams often given us hints on how processes acting on the data store, such as:
Objectives:
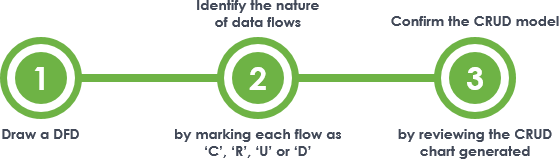
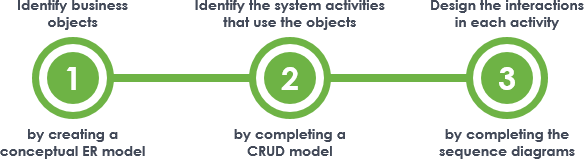
Main Steps:
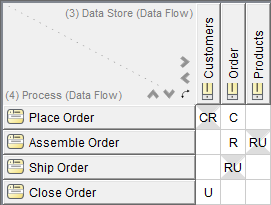
Finally, you will obtain a CRUD chart that presents how different processes use data within the system.
The figure above outlines how a CRUD Chart can be created from a DFD. In this article we will walk you through the steps in detail.
Before we continue, if you are using Visual Paradigm you can click the button below to import this tutorial into Visual Paradigm and perform the steps in the form of a wizard.
Open this Wizard in Visual ParadigmDraw a Data Flow Diagram (DFD) to model the movement of data within the target system. Complete the items below to finish this step:
Data Flow Diagrams (DFD) are used to show the movement of data within a business information system. It visualizes the transfer of data between processes, data stores and entities external to the system. System analyst uses Data Flow Diagram to:
| Symbol | Description |
|---|---|
|
|
|
|
|
|
|
To learn more about Data Flow Diagram (DFD), please read the article What is Data Flow Diagram
Indicate the nature of data flows, which are classified as:
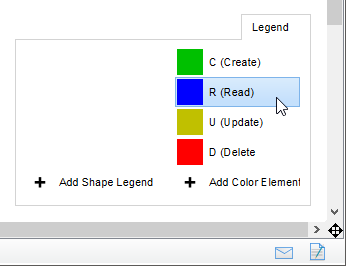
In order to complete this task, you need mark the data flows' types with the use of the Color Legend. Here are the steps to perform:
1. For each of the data flows that attach to a data store, determine its nature (either C, R, U or D).
2. Select the type from the Color Legend at the bottom right of the diagram.
3. Click on the connector to apply. You should see the connector's color updated if success. If you want to update your choice, perform step 2 again.
4. Repeat steps 1 to 3 on the other data flows.
A CRUD Chart is generated based on assignment of C, R, U and D on the data flows. This step requires you to review the CRUD chart and make any necessary changes to the layout, like to resize the columns and rows. If you want to update the assignment of C, R, U and D, please re-perform step 2. This will cause a refresh of chart content. Note that any change you make directly in the chart will not be reflected back on the Data Flow Diagram.
Click the button below to import this tutorial into Visual Paradigm and start developing MVC Sequence Diagrams for your system. The wizard not only provides the steps and guidance but also automates the transition of data among steps.
Open this Wizard in Visual Paradigm
Import into your Project
Open diagram in Visual Paradigm [?]Copy the URL below, paste it in the Open Project windows of Visual Paradigm and press Enter to open it |
MVC, short for Model-View-Controller, is a well-known software architectural concept in software engineering. MVC promotes the decoupling of a context into three interconnected parts - business objects (model), view (representation of model data) and controller (performer of business operations). The concept of MVC is widely recognized and adopted in software industry. Many modern software frameworks are created based on MVC.
MVC is also widely used together with UML modeling. In a MVC Sequence Diagram, entity objects, boundary objects and the controllers are placed in three distinct parts. Readers can gain an overview of system interactions easily by reading the communications between the three layers of components.
Objectives
Main Steps:
The figure above outlines how an MVC Sequence Diagram can be developed from scratch. In this article we will walk you through the steps in detail.
Before we continue, if you are using Visual Paradigm you can click the button below to import this tutorial into Visual Paradigm and perform the steps in the form of a wizard.
Open this Wizard in Visual ParadigmDraw a conceptual Entity Relationship Diagram (ERD) to model the business objects within the scope of the target system and the inter-relationships among these objects. When you construct the model, keep in mind that you are modeling business objects, not any database table to use in physical database construction.
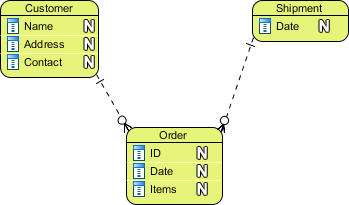
The figure above gives an example of such an ERD. The table below provides some examples of business objects.
| System | Business Objects |
|---|---|
| ATM |
|
| Library Management System |
|
An ER model is typically drawn at up to three levels of abstraction:
While all the three levels of ER model contain entities with attributes and relationships, they differ in the purposes they are created for and the audiences they are meant to target.
A general understanding to the three data models is that business analyst uses conceptual and logical model to model the business objects exist in the system, while database designer or database engineer elaborates the conceptual and logical ER model to produce the physical model that presents the physical database structure ready for database creation. The table below shows the difference between the three data models.
Conceptual ERD models the business objects that should exist in a system and the relationships between them. A conceptual ERD is developed to present an overall picture of the system by recognizing the business objects involved. It defines what entities exist, NOT which tables. For example, 'many to many' tables may exist in logical or physical data model but they are just shown as a relationship with no cardinality under the conceptual data model.
To learn more about ER Diagram, database design and the three kinds of data model, please read the article What is Entity Relationship Diagram (ERD).
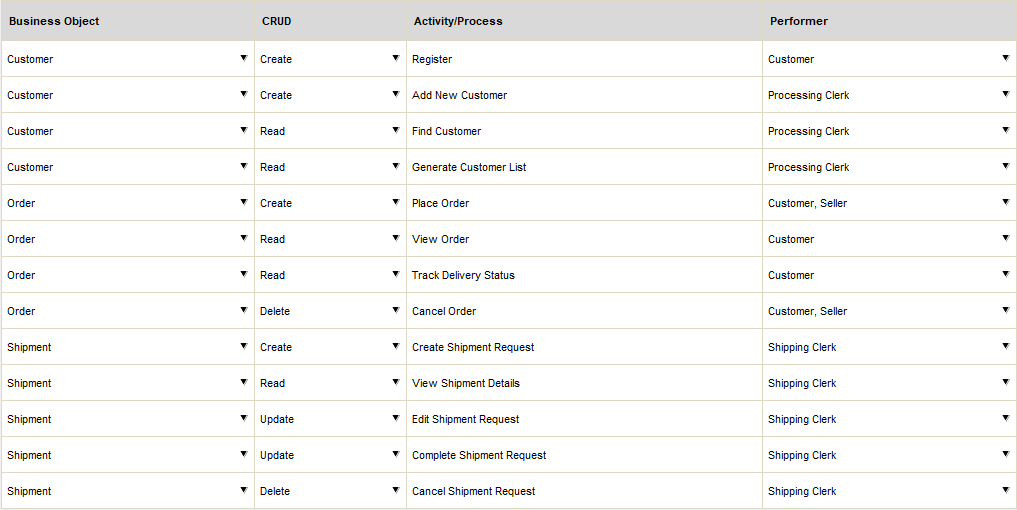
Now that you have identified a set of business objects. In this step, you are required to find out how these objects will be used by the developing system - Are the objects created by the system, and if so, when? When will they be retrieved, modified or deleted by the system?
Now, find out the major system activities or processes that (will) create, read, update and delete those business objects. For each of the activities / processes identified, create a table row and enter the information below.
The figure below shows an example of such a table.
When you fill in the table, you may discover business objects that were not found before. Simply re-visit step 1 by updating the ERD with any new business objects found. If you are running this tutorial in our STEPS Wizard in Visual Paradigm, by re-completing step 1 we will update the listing of business objects available for selection in this step.
Notes:
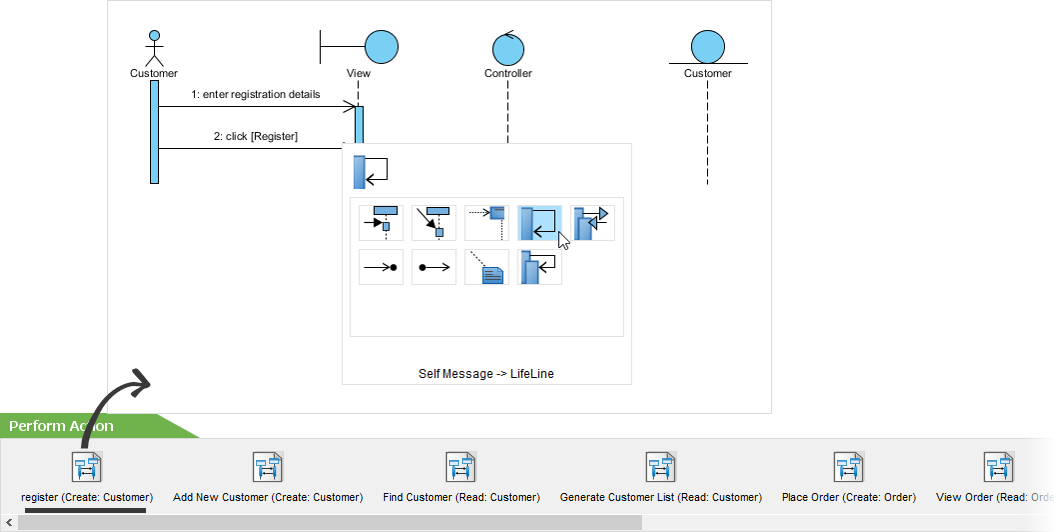
The major system activities through which business objects are created, read, updated and deleted are identified. In this step, we will take a closer look at the interactions involved in these activities. The result will be a set of MVC Sequence Diagrams that model the interactions.
If you are running this tutorial in our STEPS Wizard in Visual Paradigm, a set of initial Sequence Diagram templates have been automatically generated for each of the activities/processes identified. Each diagram template contains the following elements:
Complete the diagrams to model the MVC level interactions between the performers and the system. Here are some steps that you can follow to complete a diagram:
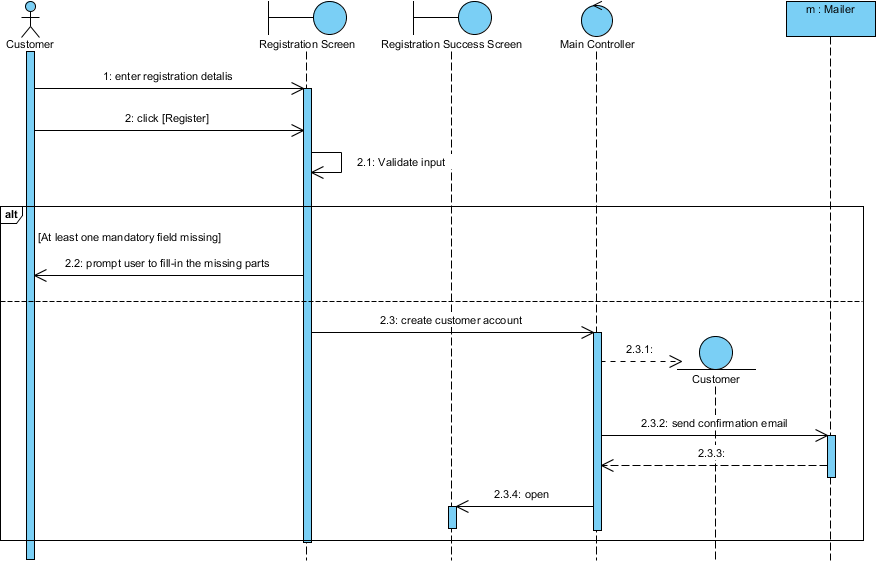
The figure below shows an MVC Sequence Diagram finished.
Click the button below to import this tutorial into Visual Paradigm and start developing MVC Sequence Diagrams for your system. The wizard not only provides the steps and guidance but also automates the transition of data among steps.
Open this Wizard in Visual Paradigm
Import into your Project
Open diagram in Visual Paradigm [?]Copy the URL below, paste it in the Open Project windows of Visual Paradigm and press Enter to open it |

Take a look at this BPMN example. Suppose that two processes are running in parallel, merge is activated when one of them ends. The result of the other is just ignored.
Example:
To speed up a query we send it to two databases once the first answer arrives we proceed and just ignore the second answer.
Import into your Project
Open diagram in Visual Paradigm [?]Copy the URL below, paste it in the Open Project windows of Visual Paradigm and press Enter to open it |
Posted by:

Here is a BPMN business process diagram example that shows the representation of collaboration.
Sometimes there are valid business reasons to send the instance back upstream. Collaboration patterns as shown in the figure are quite common in BPM processes. Here the instance continues in a loop until the purchasing agent decides the negotiations are over either because they have the lowest price possible or they decided to purchase from another bidder.
Import into your Project
Open diagram in Visual Paradigm [?]Copy the URL below, paste it in the Open Project windows of Visual Paradigm and press Enter to open it |
Posted by:

Here is a BPMN process diagram example that shows the use of the Cancel Case pattern.
The Cancel Case Pattern is an alternative of the Cancel Activity Pattern. However, it cancels an entire sub-process
Customers can call at any time and cancel their entire order no matter where the instance is located in the process. A cumbersome way to handle this is to have cancellation transitions in each activity of the process leading to the End.
Import into your Project
Open diagram in Visual Paradigm [?]Copy the URL below, paste it in the Open Project windows of Visual Paradigm and press Enter to open it |
Posted by:

This is a BPMN example that shows the use of Cancel Activity pattern.
The Cancel Activity Pattern is used when it is necessary to terminate all concurrent activities if one of them is terminated.
In the example, the Receive Status Notification has no human interaction and is waiting for an external notification that might never come.
Adding a Discriminator and N-out-of-M Join pattern helps solve this problem for individual activities. The upper leg inside the Split/Join in this example has the transition with the long running activity with no human interaction. The lower transition was added here to:
1. Give the clerk the chance to view the orders that are pending in the upper leg and
2. Allow the clerk the chance to cancel any orders that are pending in the upper leg.
Once the clerk cancels an instance, it reaches the Complex Gateway Join activity. The instance is removed from the Receive Status Notification activity and it continues on through the rest of the process.
Import into your Project
Open diagram in Visual Paradigm [?]Copy the URL below, paste it in the Open Project windows of Visual Paradigm and press Enter to open it |
Posted by:

Here is a BPMN diagram example for the Milestone pattern.
Sometimes, a Due transition (transition with a clock over it) can help keep a process instance moving along. Think of the Milestone pattern as a way to set an SLA for an individual activity. If an instance sits too long in the activity, it is automatically transitioned through the due transition to the next activity.
In this example, the purchasing agent will award the contract to the lowest bidder if either one of two things occurs:
1. If not all the suppliers have placed their bids, the due transition times out after one week or
2. If the same number of bids reach the Join activity that were spawned in the upstream Split-N activity.
Due transitions are sometimes used when Join, synchronous sub-process invocations and Notification Wait activities might cause bottlenecks in processes.
Import into your Project
Open diagram in Visual Paradigm [?]Copy the URL below, paste it in the Open Project windows of Visual Paradigm and press Enter to open it |
Posted by:

This is a BPMM diagram that shows the use of the interleaved routing pattern.
The Interleaved routing pattern relax the sequencing requirement for activates within a process. There is a partial ordering requirement among a set of task for Interleaved parallel routing.
In this example, getting ready for school is a bunch of ad-hoc activates in the mooring. The drive to school however, cannot happen unless the kid are ready for school.
Import into your Project
Open diagram in Visual Paradigm [?]Copy the URL below, paste it in the Open Project windows of Visual Paradigm and press Enter to open it |
Posted by:

Here is a BPD example for the BPMN process pattern Deferred Choice.
Processes sometimes need to wait for an event outside the process to occur before continuing. These events are fired from:
In this example, the instance in the process will remain in the Wait for Supplier Ok activity until it has been notified from outside the process. The event causing the notification sends in information in this example to let the process know if the product was in stock. Based on this, the instance will travel through either the conditional transition (product not in stock) or the unconditional transition.
Import into your Project
Open diagram in Visual Paradigm [?]Copy the URL below, paste it in the Open Project windows of Visual Paradigm and press Enter to open it |
Posted by:

This is a BPD example that shows the use of Multiple requiring synchronization pattern.
The Multiple requiring synchronization pattern is similar to the multiple instances with A Priori Runtime Knowledge Pattern except that it requires that all the copies of the repeated simultaneous activities must be completed to let the process continue.
Import into your Project
Open diagram in Visual Paradigm [?]Copy the URL below, paste it in the Open Project windows of Visual Paradigm and press Enter to open it |
Posted by:


