Want to have a quick overview of TOGAF Architecture Development Method? Jumpstart your TOGAF core knowledge in just 60 Mins with the Visual Paradigm TOGAF Quick Tour Videos:
Want to have a quick overview of TOGAF Architecture Development Method? Jumpstart your TOGAF core knowledge in just 60 Mins with the Visual Paradigm TOGAF Quick Tour Videos:
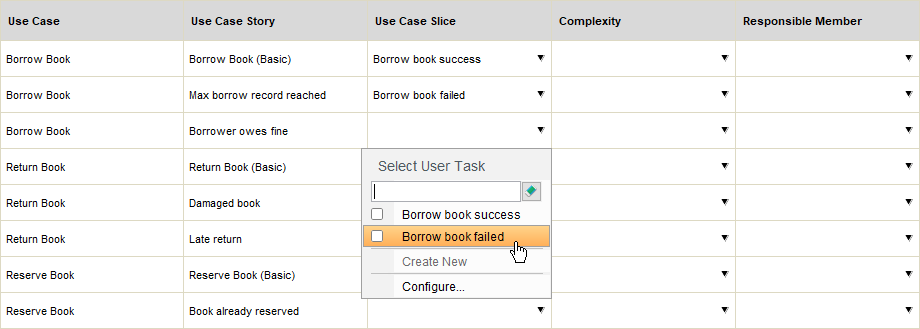
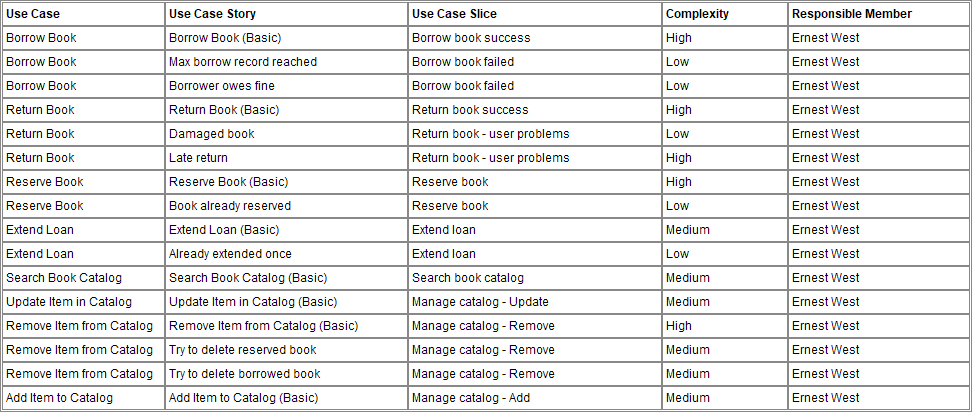
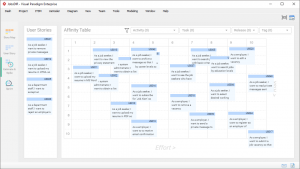
Story estimating is definitely not a easy task. But Visual Paradigm has a very useful feature to help your team on this, called Affinity Estimation Technique.
Affinity Estimate
Visual Paradigm’s Affinity Table automate the affinity estimating process for you and at the time deal with the above important issues.
| STEPS Wizard | Objectives | Compatible Editions |
|---|---|---|
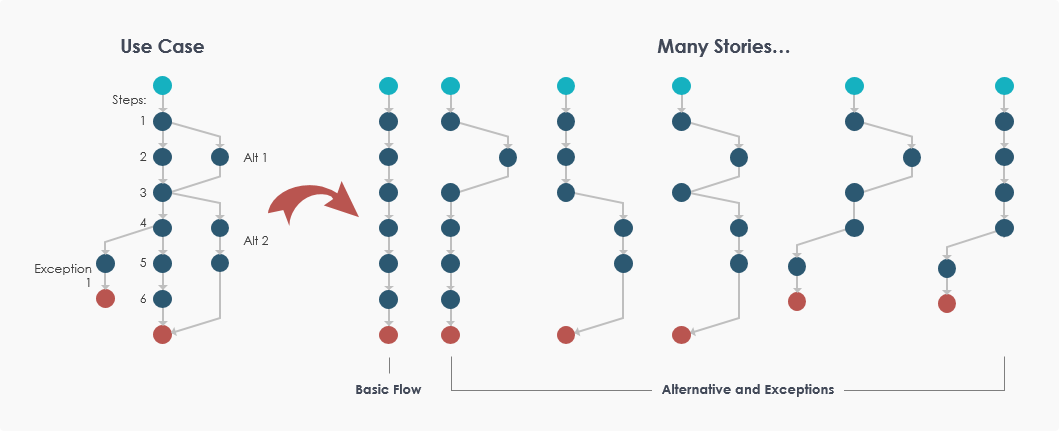
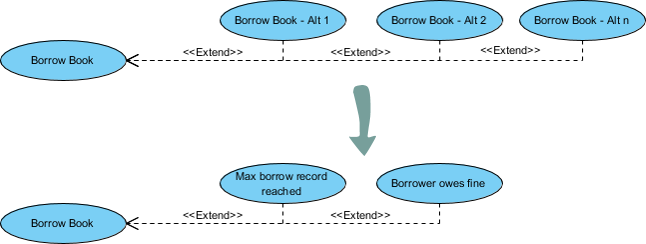
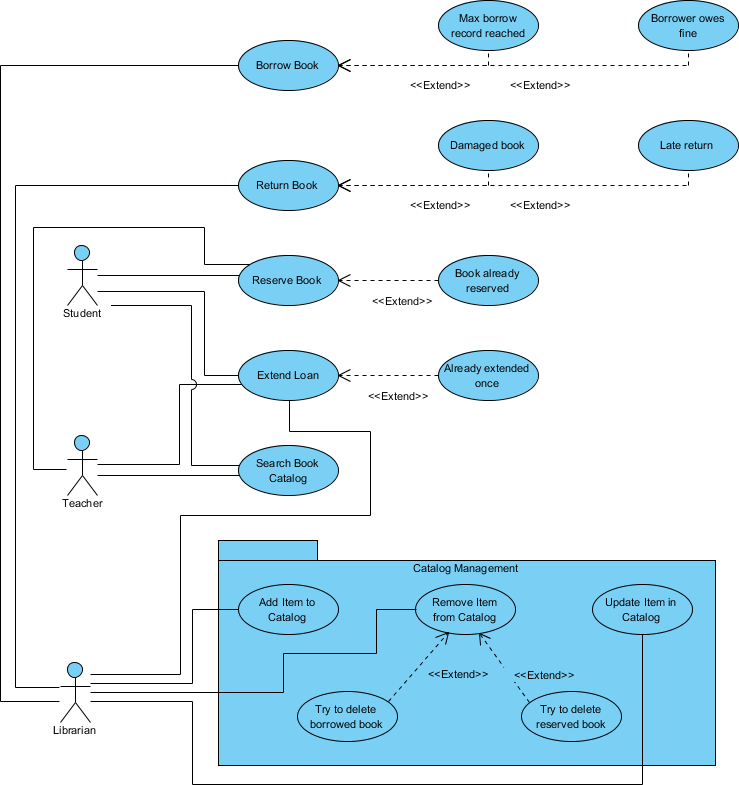
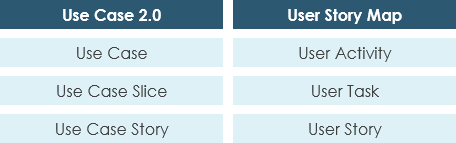
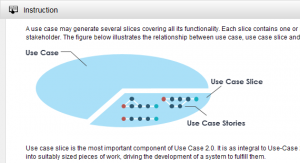
| Use Case 2.0 |
|
Enterprise / Professional |
| Developing MVC Sequence Diagrams from CRUD Model |
|
Enterprise / Professional
|
| Develop CRUD Chart from DFD |
|
Enterprise / Professional / Standard |
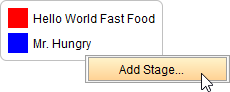
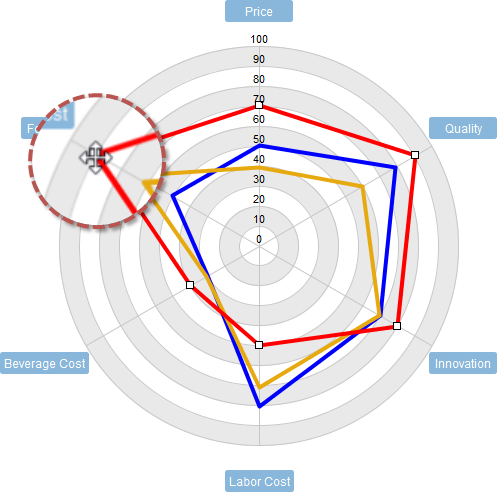
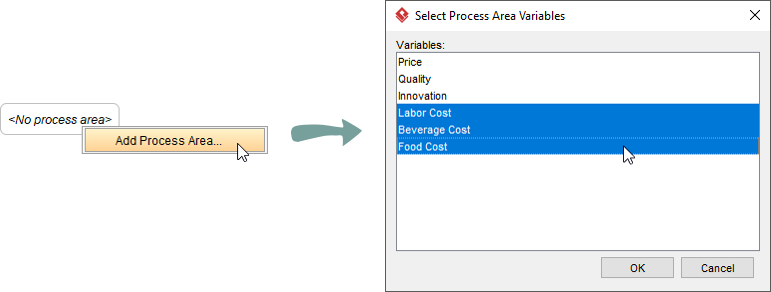
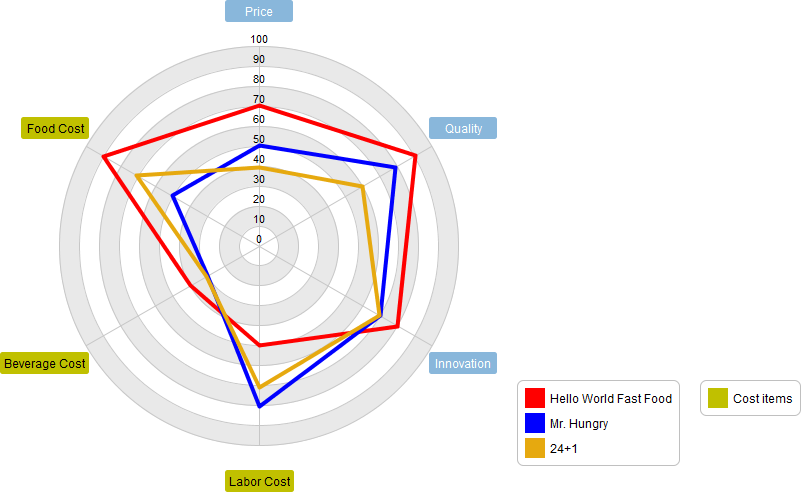
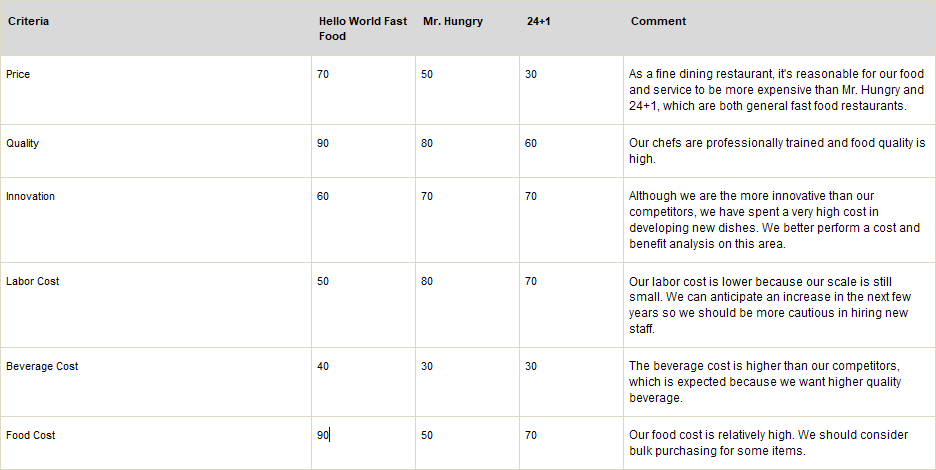
| Competitive Analysis with Radar Chart |
|
Enterprise / Professional
|
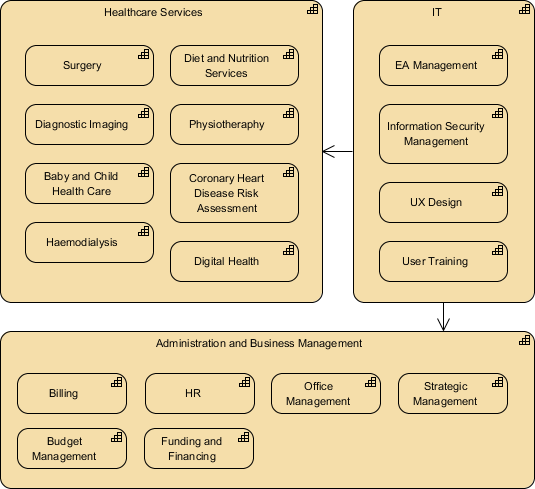
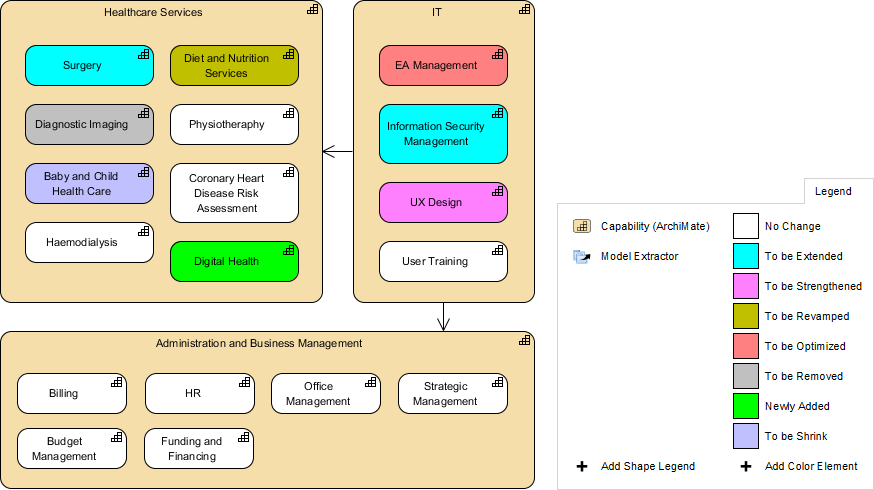
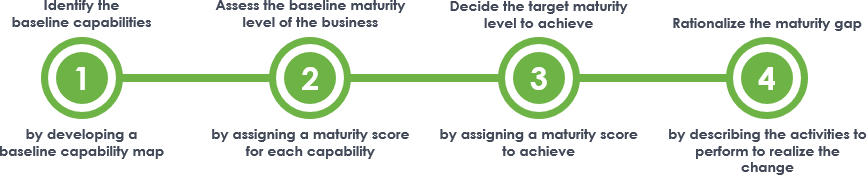
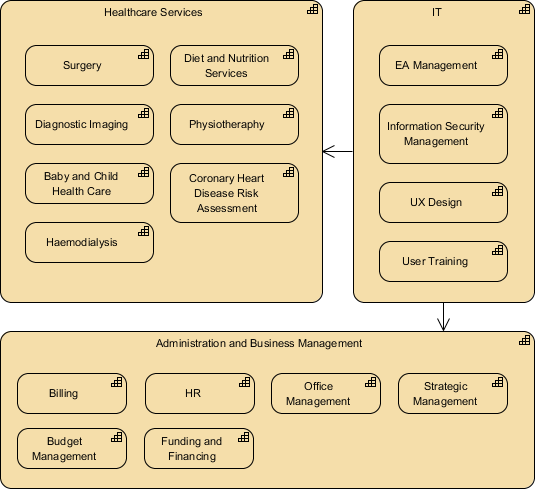
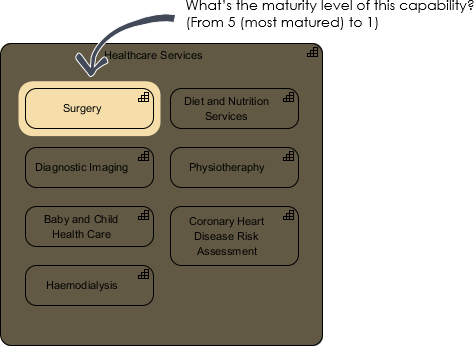
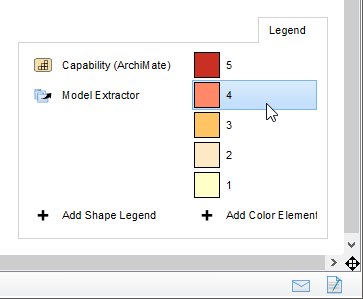
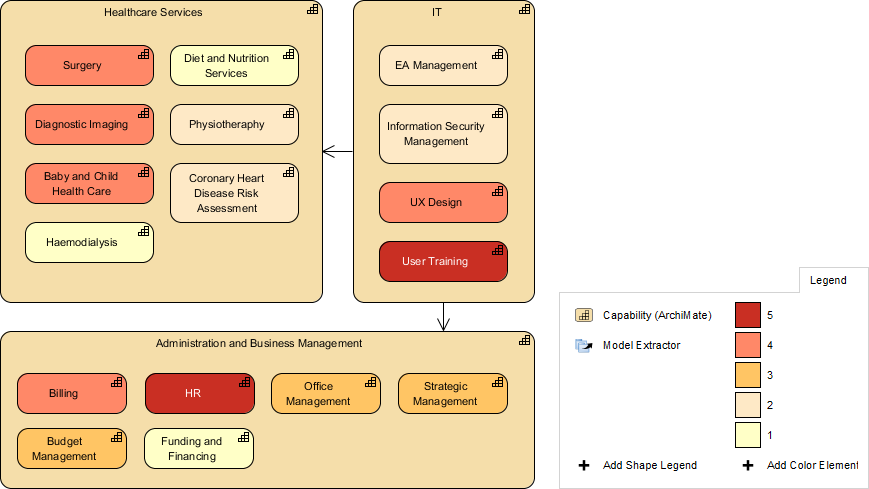
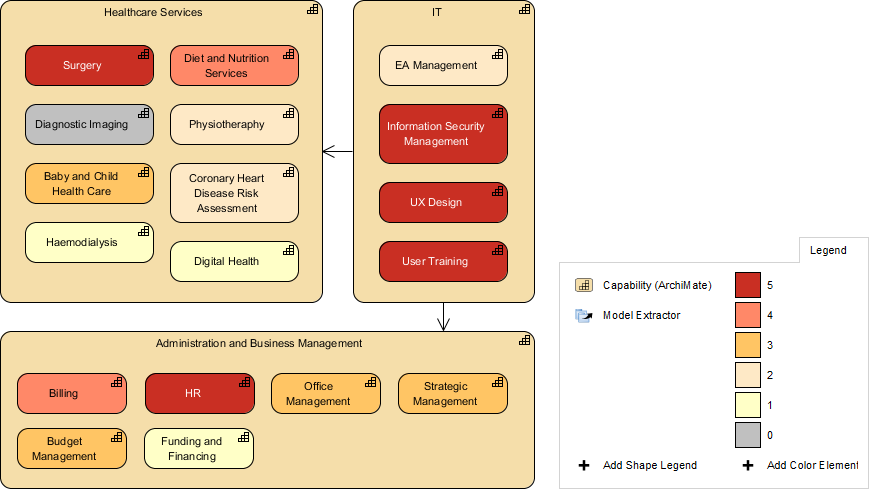
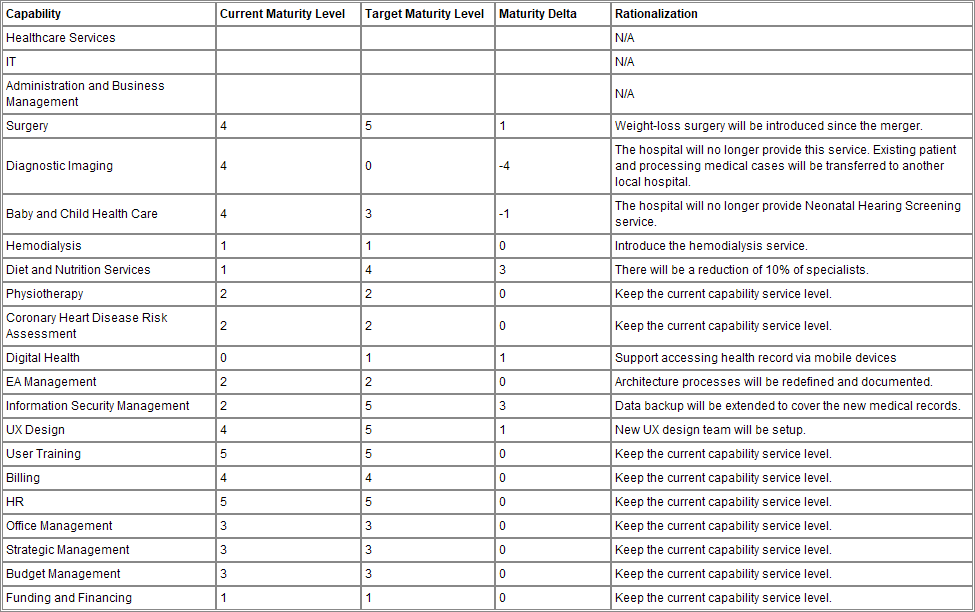
| Capability Maturity Assessment |
|
Enterprise |
| Capability-Based Transformation Planning |
|
Enterprise |
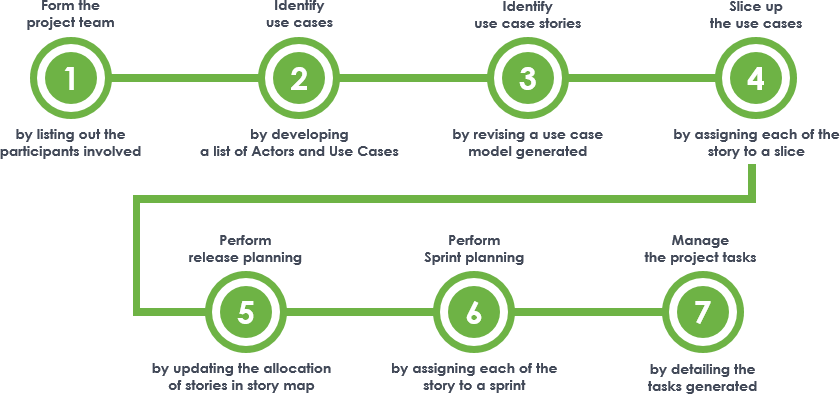
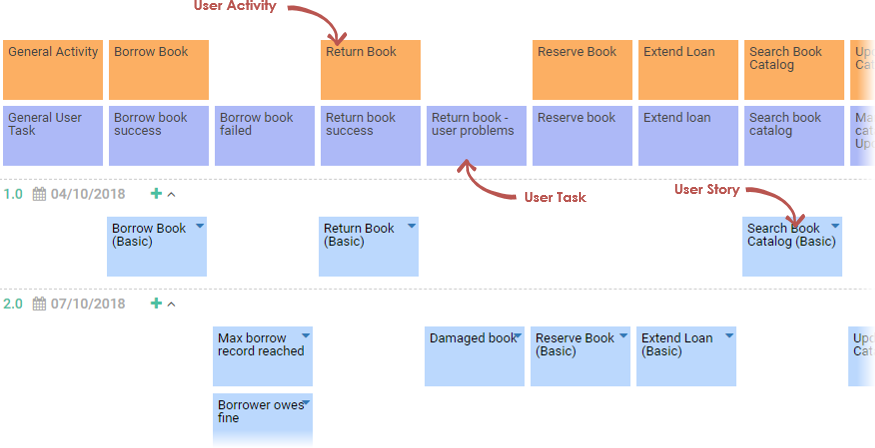
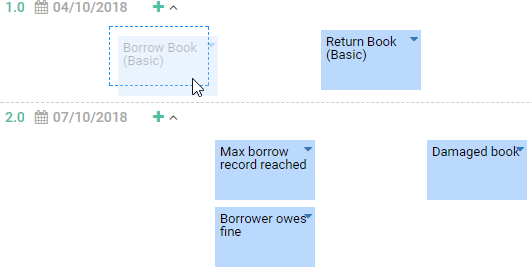
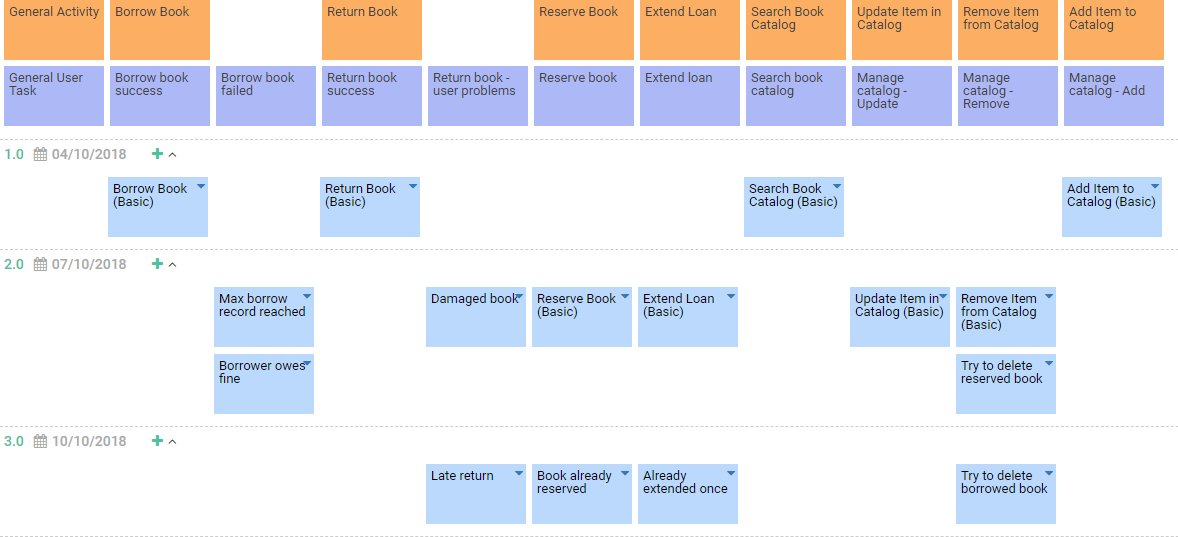
Visual Paradigm introduces STEPS – an fully automated process for agile development.
Seamless Techniques Expressed in Prescribed Steps (STEPS) is a powerful and groundbreaking feature for software development. Like a recipe that tells you how to cook a meal, STEPS are recipes that lead you through a series of well-defined steps for conducting a particular (reusable) analysis or modeling pattern for certain aspect of your development process. Your team can reuse or choose the appropriate Wizard in your project from the default set provided by Visual Paradigm.
Your work will be transformed automatically from one step to another. All the transformation is done behind-the-scene. You will get accurate result without any extra configuration and re-work.
![]()
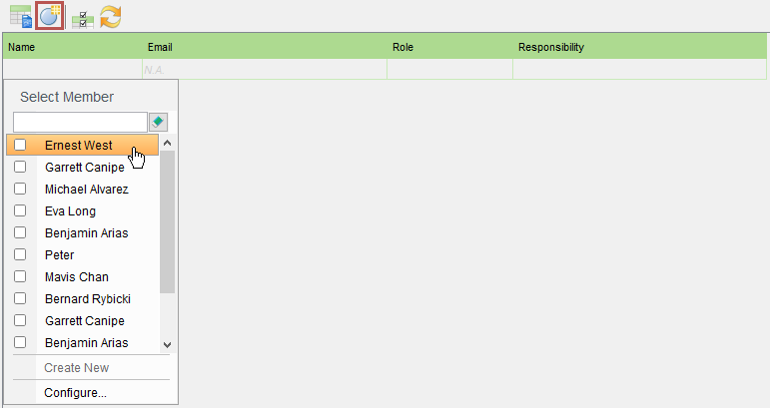
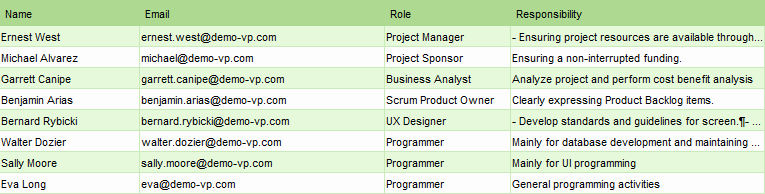
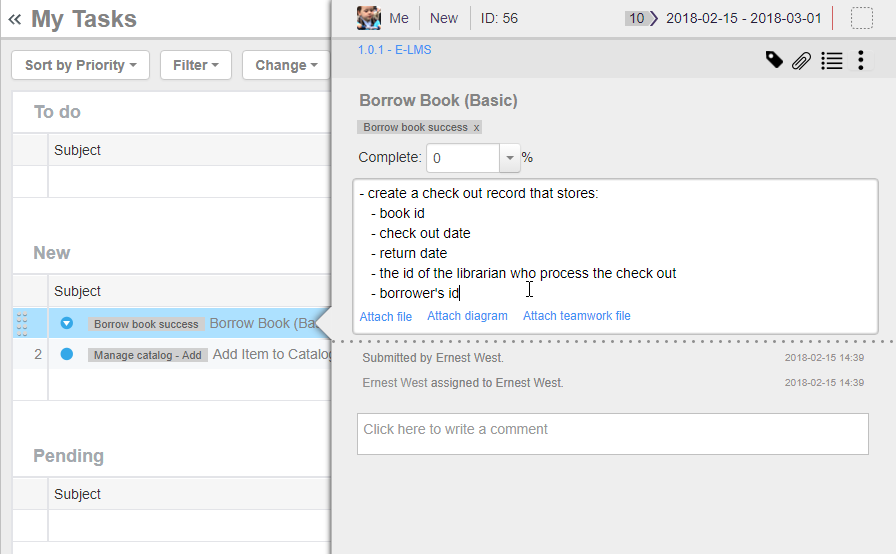
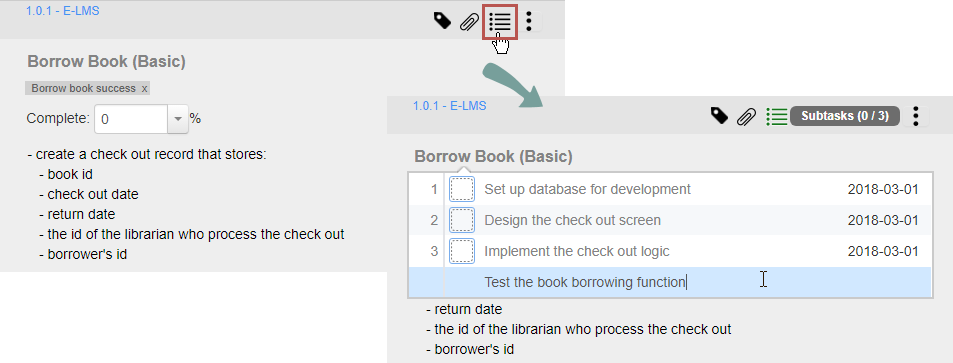
All the steps have instructions documented. The instructions do not just guide you through the completion of step but also provides you with tips and additional material in learning about the intent and rationale behind what you are doing.
In addition to the colors, other notational cues can be used to distinguish between the layers of the framework in ArchiMate. A letter ‘M’, ‘S’, ‘B’, ‘A’, ‘T’, ‘P’, or ‘I’ in the top-left corner of an element can be used to denote a Motivation, Strategy, Business, Application, Technology, Physical, or Implementation & Migration element, respectively.
An example of this notation is depicted in Example below:
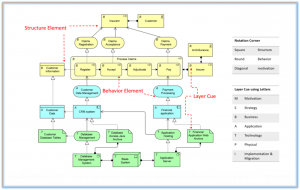
The standard notation also uses a convention with the shape of the corners of its symbols for different element types, as follows:
• Square corners are used to denote structure elements.
• Round corners are used to denote behavior elements.
• Diagonal corners are used to denote motivation elements.
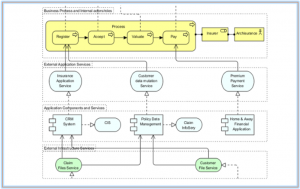
In many of the example models presented in the ArchiMate Specification, colors are used to distinguish between the layers and extension.