Open post

Ticket Selling System

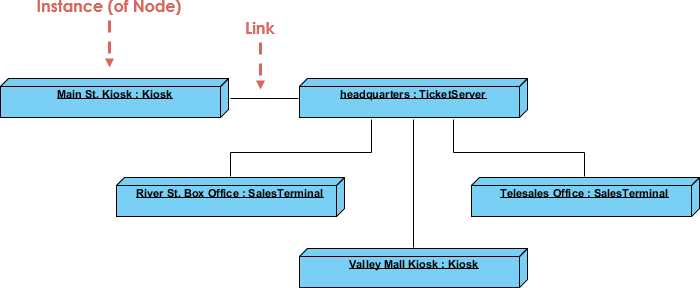
The deployment view represents the arrangement of run-time component instances on node instances. A node is a run-time resource, such as a computer, device, or memory. This view permits the consequences of distribution and resource allocation to be assessed.

This deployment diagram example shows a descriptor-level deployment diagram for the Ticket Selling System. This diagram shows the kinds of nodes in the system and the kinds of components they hold. A node is shown as a cube symbol.

Import into your Project
Open post

Ticket Selling System

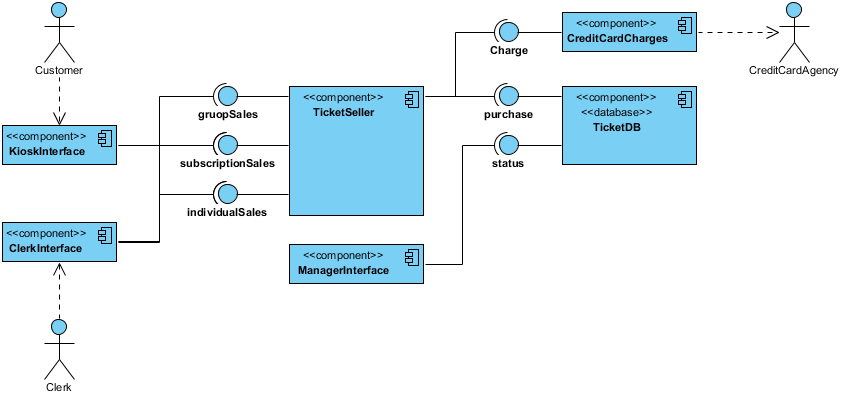
In this component diagram example, there are three user interfaces:

  1. one each for customers using a Ticket Selling System
  2. clerks using the on-line reservation system
  3. supervisors making queries about ticket sales.
  • There is a ticket seller component that sequentializes requests from both ticket selling system and clerks
  • A component that processes credit card charges; and the database containing the ticket information.

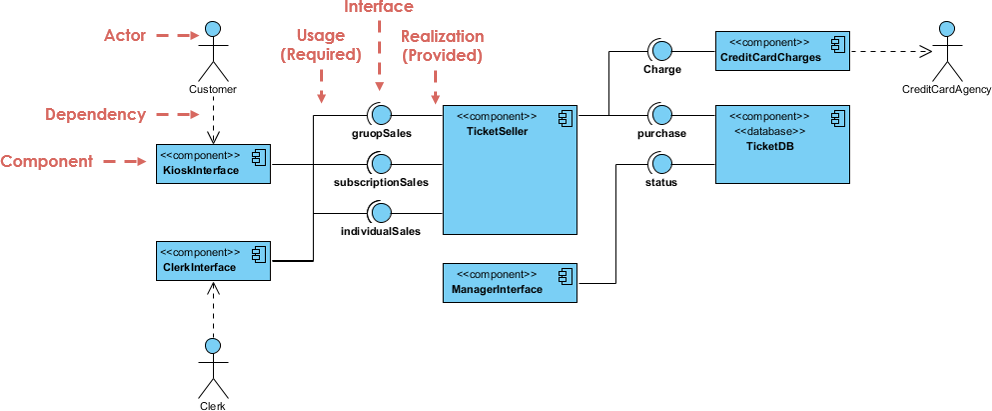
The component diagram shows the kinds of components in the system; a particular configuration of the application may have more than one copy of a component. A small circle with a name is an interface—a coherent set of services. A solid line from a component to an interface indicates that the component provides the services listed in the interface. A dashed arrow from a component to an interface indicates that the component requires the services provided by the interface.

For example, subscription sales and group sales are both provided by the ticket seller component; subscription sales are accessible from both ticket selling and clerks, but group sales are only accessible from a clerk.

Import into your Project
Open post

Planning a Show

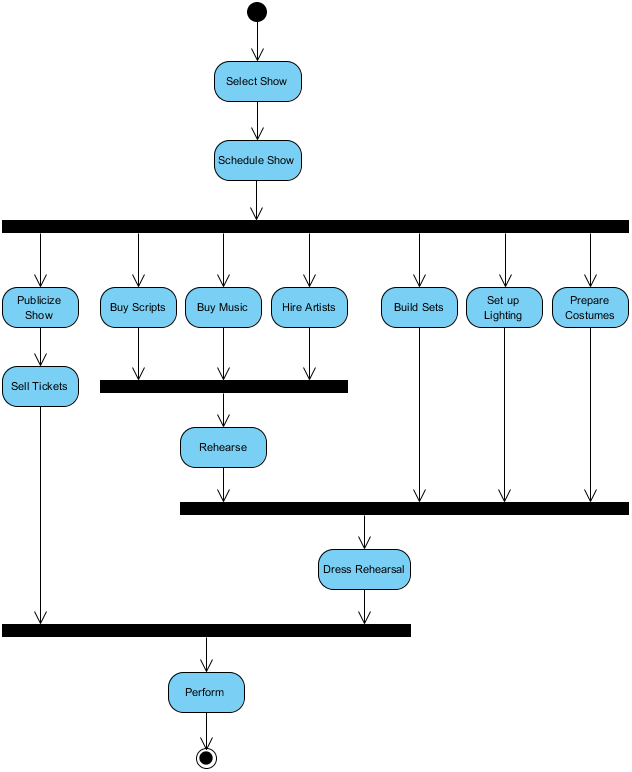
This activity diagram example shows an activity diagram for the theatre office. This diagram shows the activities involved in planning a show.

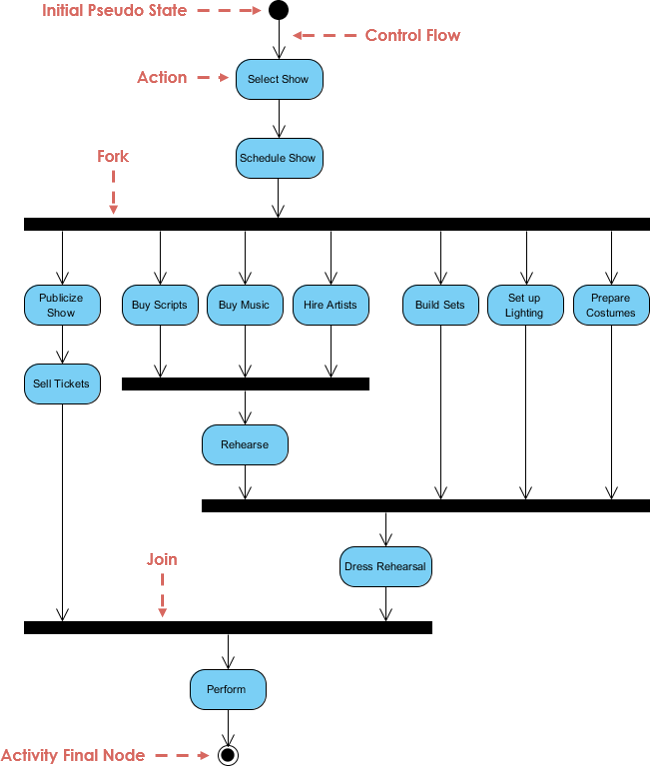
  1. Arrows show sequential dependencies—for example, shows must be picked before they are scheduled.
  2. Heavy bars show forks or joins of control. For example, after the show is scheduled, the theatre can begin to publicize it, buy scripts, hire artists, build sets, design lighting, and make costumes, all concurrently. Before rehearsal can begin, however, the scripts must be ordered and the artist must be hired.

An activity diagram is helpful in understanding the high-level execution behavior of a system, without getting involved in the internal details of message passing required by a collaboration diagram.

Import into your Project
Open post

State Machine Diagram – Ticket Selling System

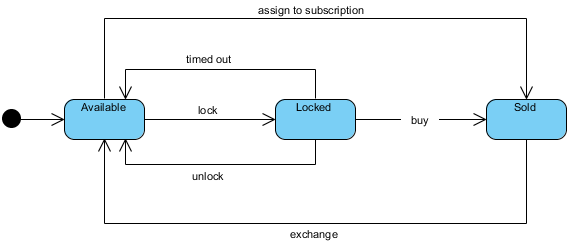
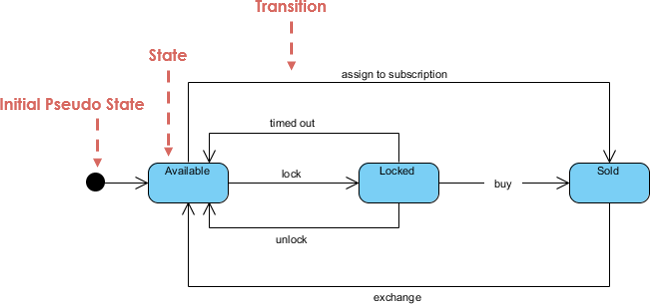
This state machine diagram example shows a state diagram for the history of a ticket to a performance.

  1. The initial state of a ticket (shown by the black dot) is the Available state. Before the season starts, seats for season subscribers are assigned.
  2. Individual tickets purchased interactively are first locked while the customer makes a selection.
  3. After that, they are either sold or unlocked if they are not chosen.
  4. If the customer takes too long to make a selection, the transaction times out and the seat is released.
  5. Seats sold to season subscribers may be exchanged for other performances, in which case they become available again.
Import into your Project
Open post

From Use Case to System-Level Sequence Diagram

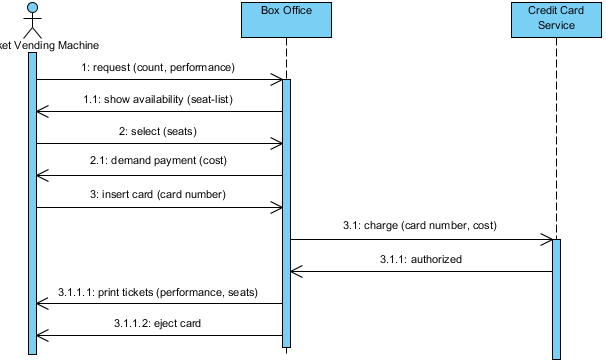
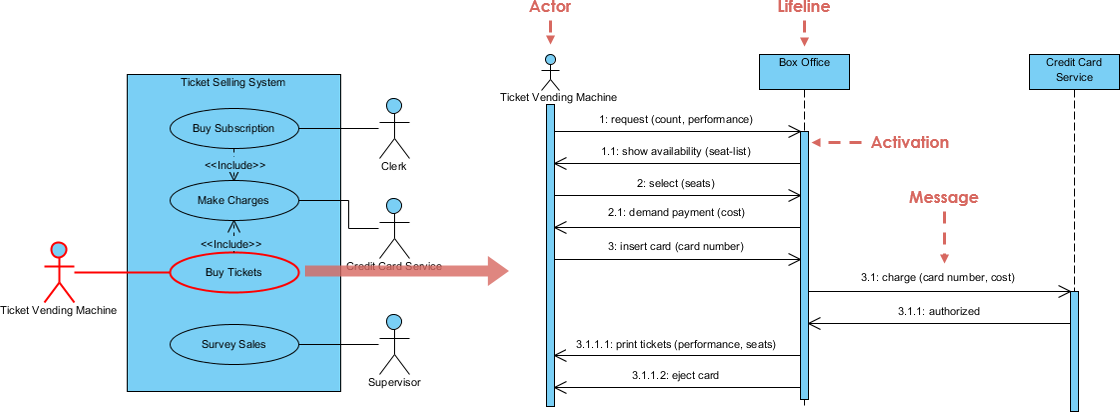
This Sequence Diagram example shows a sequence diagram for the buy tickets use case. This use case is initiated by the customer at the ticket vending machine communicating with the box office. The steps for the make charges use case are included within the sequence, which involves communication with both the ticket vending machine and the credit card service. This sequence diagram is at an early stage of development and does not show the full details of the user interface. For example, the exact form of the seat list and the mechanism of specifying seats must still be determined, but the essential communication of the interaction has been specified by the use case.

Import into your Project
Open post

Identify Objects and Operations for a Use Case

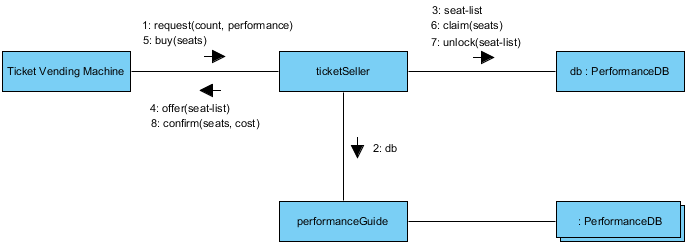
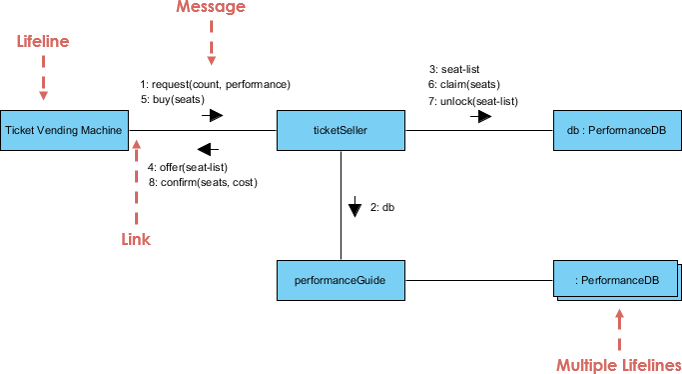
Communication diagram can help us to identify potential objects and operations for the ticket selling system at a later stage of development. Its collaboration shows the interaction among internal objects in the application to reserve tickets. The request arrives from the ticket selling system and is used to find the database for the particular performance from the set of all performances. The pointer db that is returned to the ticketSeller object represents a local transient link to a performance database that is maintained during the interaction and then discarded. The ticket seller requests a number of seats to the performance; a selection of seats in various price ranges is found, temporarily locked, and returned to the kiosk for the customer’s selection. When the customer makes a selection from the list of seats, the selected seats are claimed and the rest are unlocked.

Here is a Communication Diagram that shows the idea.

Import into your Project
Open post

External System as Actor

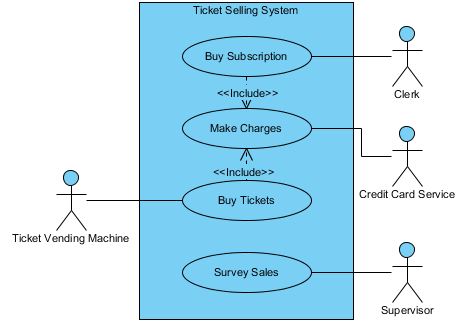
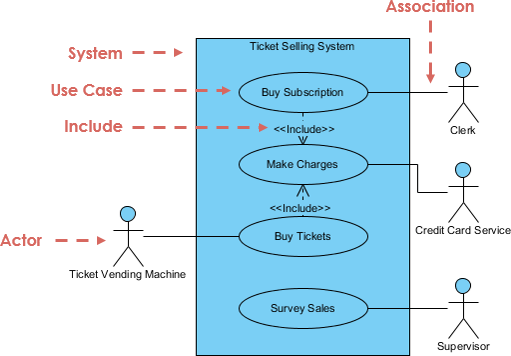
In this use case diagram example, actors include the clerk, supervisor, and Ticket Vending Machine. The Ticket Vending Machine is another system that accepts orders from a customer. The customer is not an actor in the box office application because the customer is not directly connected to the application. Use cases include buying tickets through the Ticket Vending Machine or the clerk, buying subscriptions (only through the clerk), and surveying total sales (at the request of the supervisor). Buying tickets and buying subscriptions include a common fragment—that is, making charges to the credit card service. (A complete description of a box office system would involve a number of other use cases, such as exchanging tickets and checking availability.)

Use cases can also be described at various levels of detail. They can be factored and described in terms of other, simpler use cases. A use case is implemented as a collaboration in the interaction view.

Import into your Project
Open post

Ticket Selling System

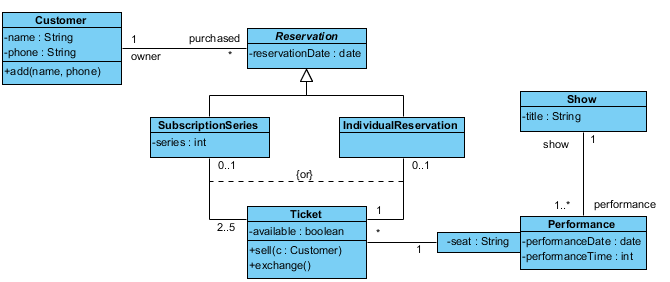
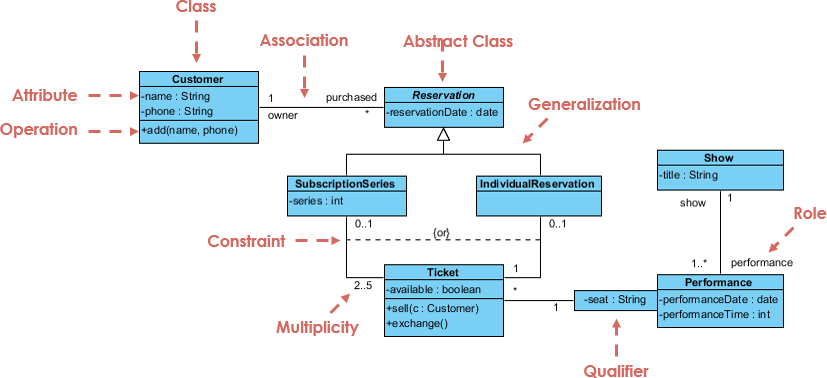
This class diagram example shows several important classes, such as Customer, Reservation, Ticket, and Performance:

  • Customers may have many reservations, but each reservation is made by one customer.
  • Reservations are of two kinds: subscription series and individual reservations.
  • Both reserve tickets: in one case, only one ticket; in the other case, several tickets. Every ticket is part of a subscription series or an individual reservation, but not both.
  • Every performance has many tickets available, each with a unique seat number. A performance can be identified by a show, date, and time.

Classes can be described at various levels of precision and concreteness. In the early stages of design, the model captures the more logical aspects of the problem. In the later stages, the model also captures design decisions and implementation details. Most of the views have a similar evolutionary quality.

Import into your Project
Open post

Eliminating Project Risks

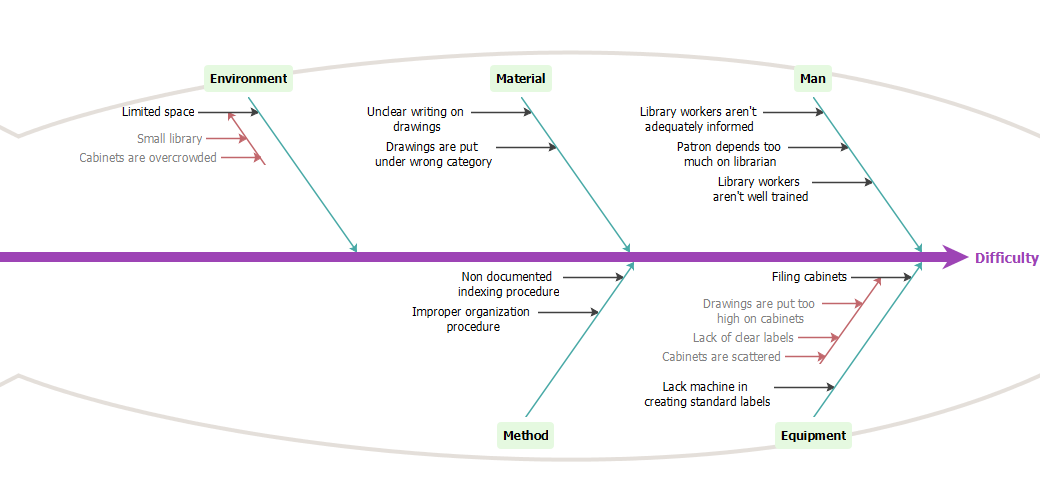
This is a Cause and Effect diagram that represents project risks.

Software could be associated with serious problems, the adoption of agile methods are not immune to such troubles. In order to identify what can go wrong in a project, a project team brainstorm with a cause-and-effect analysis also Ishikawa or fishbone diagram. The value of the analysis is to systematically list all the possible problems that any occur, such as schedule slips might be obvious, but others such as scope creep (the desire to add features after the analyst hears new stories) or developing features with little value are not as obvious.false

Import into your Project
Open post

Prepare Project Proposal

Here is a PERT chart example that shows the tasks in within a system analysis and design life cycle.

Suppose a systems analyst is trying to set up a realistic schedule for the data gathering and proposal phases of the systems analysis and design life cycle. The systems analyst looks over the situation and lists activities that need to be accomplished along the way, and formed a PERT Chart.

Import into your Project

Posts navigation

1 2 3 29 30 31 32 33 34 35 45 46 47