Open post

Drawing Diagrams Online with Visual Paradigm’s Unique User Experience – with Zero Configuration!

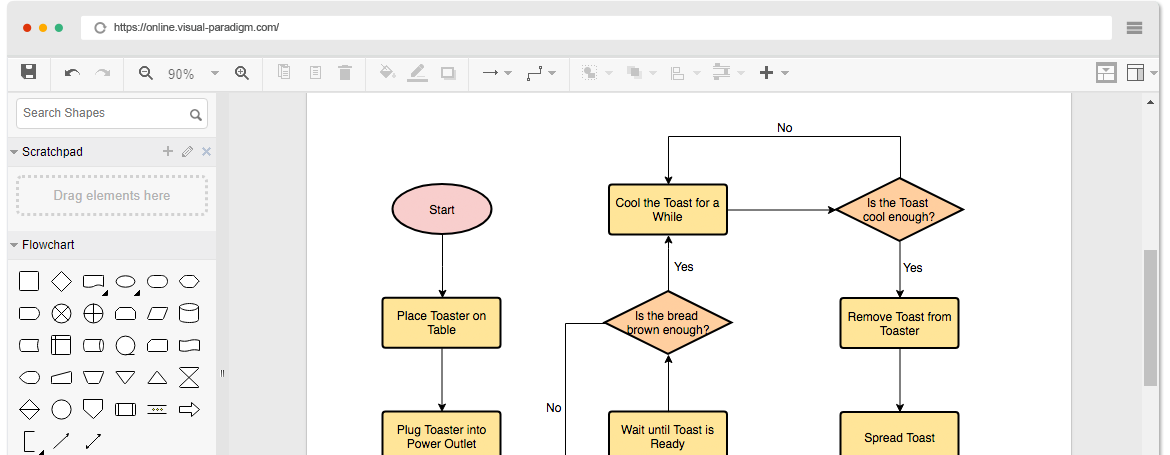
Simple and intuitive diagram editor

Creating professional drawing is easier than you think. With few drags, you get a beautiful and professional-looked drawing that can express your idea well.

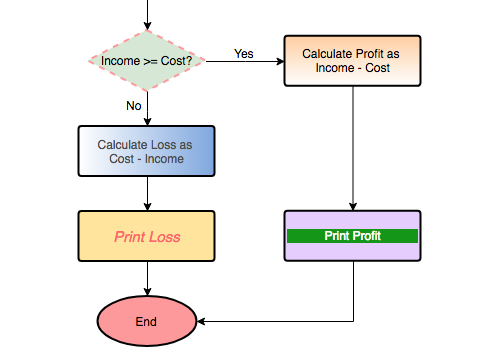
One drag to create shape

Create shape and the line connecting it with just one drag. It’s direct, intuitive and time saving.

Alignment guide

The guides appear as you drag a shape on a diagram in alignment with another shape, helping you to place shapes precisely.
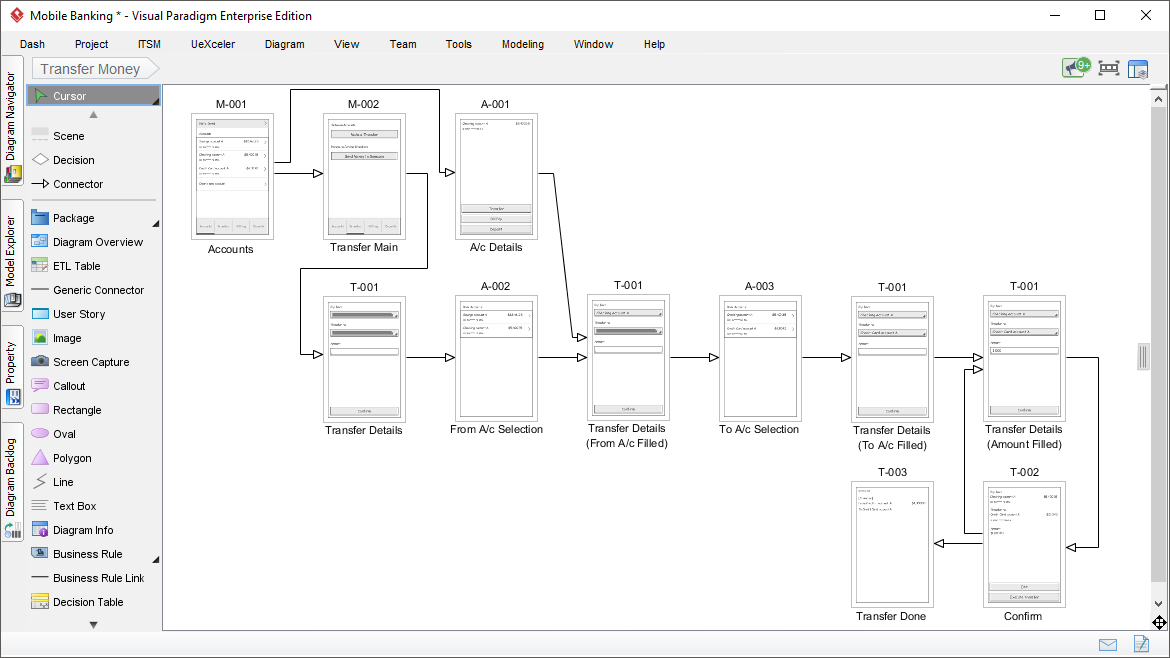
Drag to create shape

Easy to use connector in VP Online

Friendly connectors

Connectors are automatically created when you create a shape from an existing one. No additional effort is needed to make connectors connected. And when a shape is being moved, the connectors that attached will be re-routed themselves to follow. Finally, there are over 40 kinds of connector and arrow heads that fit any kind of connectivity needs.


Powerful editing and formatting tools

Style your drawing to match your company’s corporate identity or your personal needs. VP Online supports a large set of editing functions, from standard functions like copy & paste, grouping, fill and line format, to advanced options like shape rotation, alignment, etc.

  • Solid and gradient fill and line color
  • Rotatable shapes
  • Align and distribute shapes
  • Rich text captions
  • Grouping
Powerful editing and formatting tools

Learn More:


Open post

Combining the Power of Wireframing and Prototype into Your Hands?

Is it possible to put the power of wireframing and prototype into the hands UX Designers or Business Analysts? Unfortunately, most of the prototyping software are over-complicated that require strong IT technical background and programming knowledge… Visual Paradigm’s WireFlow diagram is specifically designed for people from non IT background. So what is the Visual Paradigm’s WireFlow feature anyway?

Wireframes is a widely adopted UX tool that allows UX designers and clients to work together in identifying the content and functionality of screens. A wireflow makes UX even more effective by harnessing the power of wireframe and flowchart, creating a step-based UX diagram that illustrates the steps and decision points of particular scenarios and the possible navigation paths throughout these steps.

The wireflow flowchart editor of Visual Paradigm allows fast creation of wireframe-based flowchart. Create flowcharts of any complexity and show them to your clients in both animation and print form.

Animate path in action!

As long as a user interaction involves alternate and exceptional cases, there are multiple paths of wireflow that can be navigated. To reduce the application complexity, the wireflow editor allows you to specify a particular path (or often called scenario) of wireflow to be animated, so that we can split a user feature to be in sync with the partition of a simple user story or testing scenario. By this way, we can focus on some normal scenario of a features and in turns, the alternatives, making your development agile and just-in-time.


Open post

Learning TOGAF ADM in 60 Mins

Want to have a quick overview of TOGAF Architecture Development Method? Jumpstart your TOGAF core knowledge in just 60 Mins with the Visual Paradigm TOGAF Quick Tour Videos:

  1. Introduction to TOGAF ADM: (Part 1) Preliminary Phase
  2. Introduction to TOGAF ADM (Part 4): Phase E Opportunities and Solutions
Open post

How to Estimate User Stories?

Story estimating is definitely not a easy task. But Visual Paradigm has a very useful feature to help your team on this, called Affinity Estimation Technique.

Affinity Estimate 

  1. Estimate use stories in relative terms.
  2. Keep estimates manageable.
  3. Deal with spikes in early stage.

Visual Paradigm’s Affinity Table automate the affinity estimating process for you and at the time deal with the above important issues.

Why Visual Paradigm Affinity Table for User Stories Estimation?

  • streamlining the entire estimating process for your team
  • seamlessly integrated with story map and product backlog
  • Automatic calculate story point and days at the same time
  • provide traditional column based estimation or advanced matrix based estimation in switchable dual modes
  • help you to identify spikes and to be handled them in early stage

Learn More about Visual Paradigm Affinity Table Feature

Related Topics:


Open post

How Many STEPS Wizards Available So Far? And Available in What Edition?

  1. There are five STEPS Wizards available in Visual  Paradigm at the moment. There will be more wizards to be made available in the Future.
  2. The criteria of a STEPS Wizard to be made available in what Edition(s) based the diagram type(s) used in that wizard is/are also the default diagram type(s) available in the edition(s)
  • For example: ArchiMate Diagram is only available in the Enterprise Edition, so if the STEPS Wizard includes the ArchiMate diagram, then it will only be available in Enterprise Edition


STEPS Wizard Objectives Compatible Editions
Use Case 2.0
  • Identify the goals to be achieved as use cases
  • Identify the specific ways to achieve these goals as use case stories
  • Partition the stories into suitably sized pieces of work, known as use case slices
  • Produce a release plan
  • Plan out development tasks to be conducted in implementing the use cases
Enterprise / Professional
Developing MVC Sequence Diagrams from CRUD Model
  • Identify business entities for problem domain using conceptual ERD
  • Identify business services required for the problem based in basic CRUD operations
  • Elaborate the business services into MVC multiple layers of usage scenarios using sequence diagrams
Enterprise / Professional
Develop CRUD Chart from DFD
  • Interrelate processes and data stores with CRUD operations (CREATE, READ, UPDATE, DELETE)
  • Visualize the CRUD operations in a matrix format for further analysis
Enterprise / Professional / Standard
Competitive Analysis with Radar Chart
  • Clearly displays the important categories
  • Clearly defines full performance in each category
  • Makes concentrations of strengths and deficiencies visible
  • Automatic transform data into tabular format for further actions and comments
Enterprise / Professional
Capability Maturity Assessment
  • Stock taking of capability of an enterprise in a holistic view
  • Visualize the capability level of an enterprise as a whole
  • Identify what areas of the enterprise are required to increase or optimize capability
  • Identify the architectural focus areas that will support the development of the architecture
Enterprise
Capability-Based Transformation Planning
  • Stock taking of capability of an enterprise in a holistic view
  • Identify the transformation strategy required to realize each of the capability
  • Identify what action(s) are required to perform during the transformation
Enterprise


Open post

Use Case 2.0 For Agile Development

Visual Paradigm introduces STEPS – an fully automated process for agile development.

So what is STEPS anyway?

Seamless Techniques Expressed in Prescribed Steps (STEPS) is a powerful and groundbreaking feature for software development. Like a recipe that tells you how to cook a meal, STEPS are recipes that lead you through a series of well-defined steps for conducting a particular (reusable) analysis or modeling pattern for certain aspect of your development process. Your team can reuse or choose the appropriate Wizard in your project from the default set provided by Visual Paradigm.

Seamless transformation of data

Your work will be transformed automatically from one step to another. All the transformation is done behind-the-scene. You will get accurate result without any extra configuration and re-work.

Learn through STEPS

All the steps have instructions documented. The instructions do not just guide you through the completion of step but also provides you with tips and additional material in learning about the intent and rationale behind what you are doing.

Learn More About STEPS and Use Case 2.0


Open post

Distinguish between the layers in ArchiMate using Notational Cues

In addition to the colors, other notational cues can be used to distinguish between the layers of the framework in ArchiMate. A letter ‘M’, ‘S’, ‘B’, ‘A’, ‘T’, ‘P’, or ‘I’ in the top-left corner of an element can be used to denote a Motivation, Strategy, Business, Application, Technology, Physical, or Implementation & Migration element, respectively.

An example of this notation is depicted in Example below:

Shape Convention in ArchiMate

The standard notation also uses a convention with the shape of the corners of its symbols for different element types, as follows:

•  Square corners are used to denote structure elements.

•  Round corners are used to denote behavior elements.

•  Diagonal corners are used to denote motivation elements.

Related Resources

https://archimate.visual-paradigm.com/