There are many reasons why you want to know how a diagram looked like at some point in time. First, you may find the latest design not feasible and you want to see how the feasible one looked like in the past. Second, you may spot a flaw/mistake and you want to recover it by referencing the correct design you did before. And for diagrams like business process diagram, ArchiMate and business motivation model, you can observe their changes to determine the changes the business has made over the years. You can easily tell what and why the design and hence the business was changed. Such information can help you to plan the future with minimized risks.
While seeing the evolution of diagram is pretty much the most common use case, you can also see the evolution of specific shape or even a model element, say, to know what a package contained at some point in time.
Visual History enables you to see the evolution of your design. It features a side-by-side diagram viewer that allows the comparison of diagram over revisions. With the revision slider, you can easily slide across revisions to compare the diagram in the latest revision and a specific revision in the past.
Another important function of Visual History is to help recovering your work by restoring from an old revision. You can read the next chapter for details.
Browse a diagram in old revision with Visual History
To see how a diagram looked like in the past, perform the steps below.
- Right click on the background of a opening diagram and select Visual History… from the popup menu.
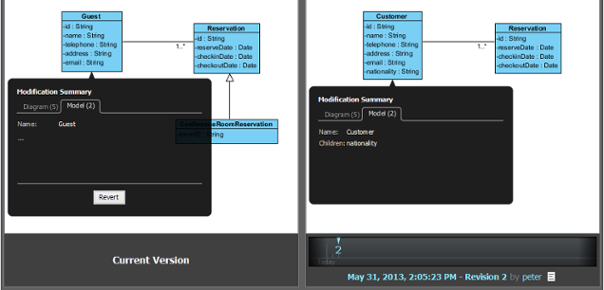
- This opens the Visual History window. At the top of the window you can see the diagram name as well as the drop down menu Show, which controls the kind of difference you want to focus on when comparing revisions. We will talk about it in the coming sections. In the middle, you see two diagram viewers. The left hand side is the diagram in the latest revision, while the right hand side is the same diagram in an old revision. You can drag the viewers to pan the diagrams. If you are comparing a model element or a shape instead of a diagram, you will see the properties of that element/shape listed here.
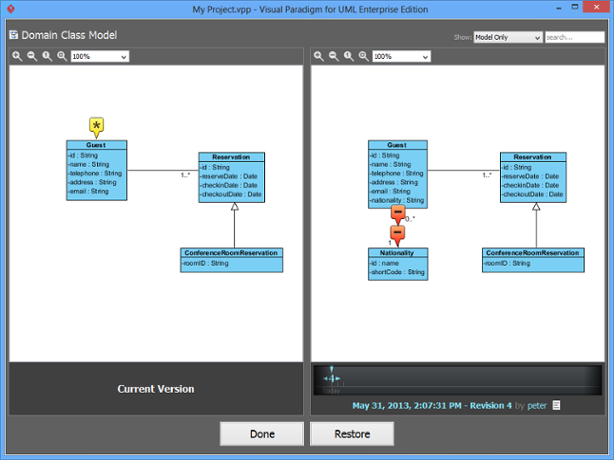
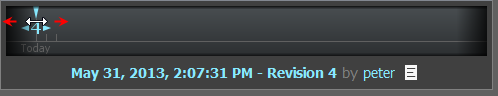
- Under the diagram viewer on the right, you see the time line. Press on the revision number and drag right or left to move to older or more recent revisions. The diagram viewer will be updated to show the diagram in the chosen revision. Note that only the revisions that reflect a change in diagram are listed on the time line. You can slide between revisions to see the evolution of diagram and to stop at certain revision to analyse and compare that revision with the latest revision, as shown in the viewer on left hand side.
Compare diagrams with the help of visual indicator
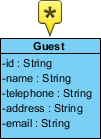
While visual difference of diagrams can be identified easily by bare eyes, you are unable to tell the changes of shape/model element properties that are not presented on diagram, such as the modification of element documentation. In order to know this kind of change, you need to check the visual indicators that appear on the diagram.
Each indicator represents a difference found when comparing the latest revision and the revision as selected in the time line. The pointer of indicator tells you where the difference is.
By clicking on an indicator, you can see a list of modified properties, categorized by diagram level property (e.g. shape position, color, etc) and model level property (e.g. name, documentation of model element, etc).
Adjust the type of difference to indicate on diagram
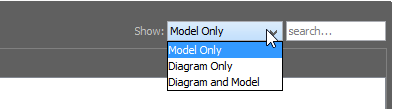
There are two kinds of differences Visual History can identify when comparing diagrams – model and diagram. Model refers to all sort of model element properties change, such as the renaming of element, addition of file reference, modification of documentation, etc. Diagram refers to all sort of shape properties change, such as shape position, shape color, etc.
If you want to focus on model element properties rather than the view level properties, you can click on the drop down menu Show at the top right of the Visual History window and select Model Only. There are also options like Diagram Only and Diagram and Model to suit different needs. The diagram viewers will be updated to show or hide away indicators after considering or ignoring the differences base on your choice.