The objective of business process modeling is to facilitate communication with stakeholders, conduct cost-benefit analyses, and drive process improvements. Simulation is a set of value-added tools that support business process modeling. Using a BPMN simulation tool, you can simulate the execution of business processes to study resource consumption (e.g., human resources, devices, etc.), identify bottlenecks, and quantify differences between improvement options. This helps in analyzing and implementing effective process improvements.
Key concepts
Resources
Resources refer to any type or form of input essential for the execution of a process. Each resource has three properties: name, type, and amount. There are two categories of resources—available resources and required resources.
- Available resources are those that are accessible to the business process but may not be fully utilized. For example, a post office may have 10 service counters available, but only 3 are in use during peak hours.
- Required resources are specified at the flow-object level. You can define the type and quantity of resources needed by configuring each flow object. For instance, the task Answering Enquiries may require one service counter as a resource.
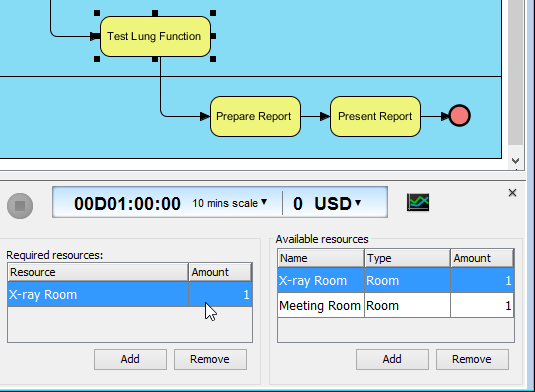
Resource allocation is often critical to the efficiency of a business process. For example, having more staff and service counters available can improve the efficiency of customer service. However, if the number of available staff and counters exceeds what is actually needed, the unused resources result in waste. Simulation helps determine the optimal resource allocation by evaluating the resource consumption of the current process.
Duration
Duration refers to the time elapsed from when a flow object is entered to when it is exited. Understandably, the duration of a flow object has a significant impact on the overall efficiency of a business process. For example, if it takes five minutes to complete just one payment in a supermarket, a long queue will quickly build up as more customers arrive to check out.
Input
Input is a way of simulating how a business process behaves under certain conditions. Each input has a name that describes the event, and an instance, which is a number representing how many times the input occurs at a particular moment.
For example, if you have modeled a general order processing system, you might add an input called public holiday with an instance value of 100 to simulate a scenario where 100 customers need to make payments during a public holiday.
To gain meaningful insights for process improvement, inputs must realistically reflect actual conditions. If you set the instance of public holiday to an unrealistic value like 10,000—when that scenario would never occur—you won’t obtain useful or actionable data from the simulation.
Simulation
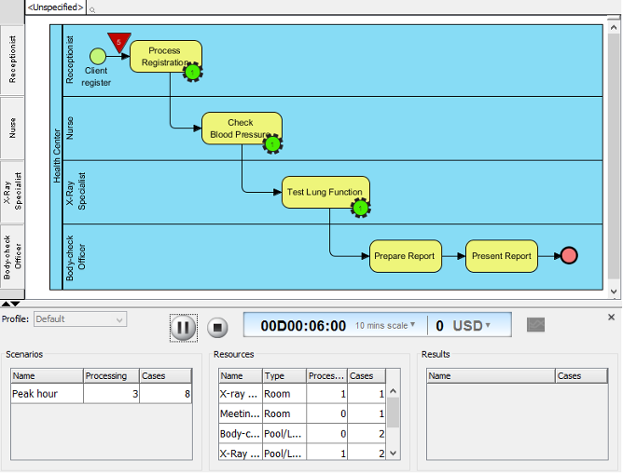
Once you have defined the available and required resources, specified the duration for each flow object, and added input(s), you can run the simulation. During simulation, the diagram will be locked to prevent conflicts between your edits and the simulation operation.
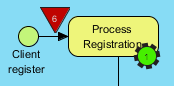
Executing jobs are represented by green gear icons, with a number indicating how many jobs are currently in progress. These icons appear on the tasks where the jobs are being processed. Pending jobs are shown as inverted triangles, with a number indicating how many jobs are waiting to be processed.
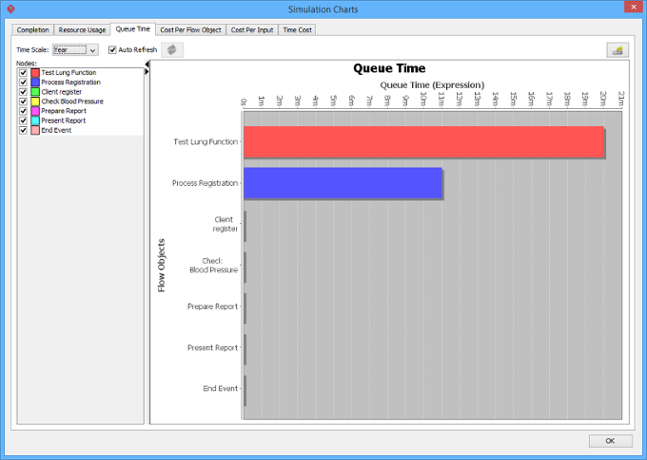
Performance analysis through charts
During business process simulation, bottlenecks can be identified by observing the occurrence of pending jobs (represented by inverted triangles). This method works well for relatively small processes. However, if your business process diagram is large, visual observation alone may not be sufficient, as the simulation may be lengthy and involve multiple bottlenecks.
Additionally, you may need precise data on resource consumption to develop a more accurate resource reallocation plan. In such cases, simulation charts can be generated. These charts document input completion, resource usage, and flow object queue times over time, providing a clearer and more detailed view of process performance.